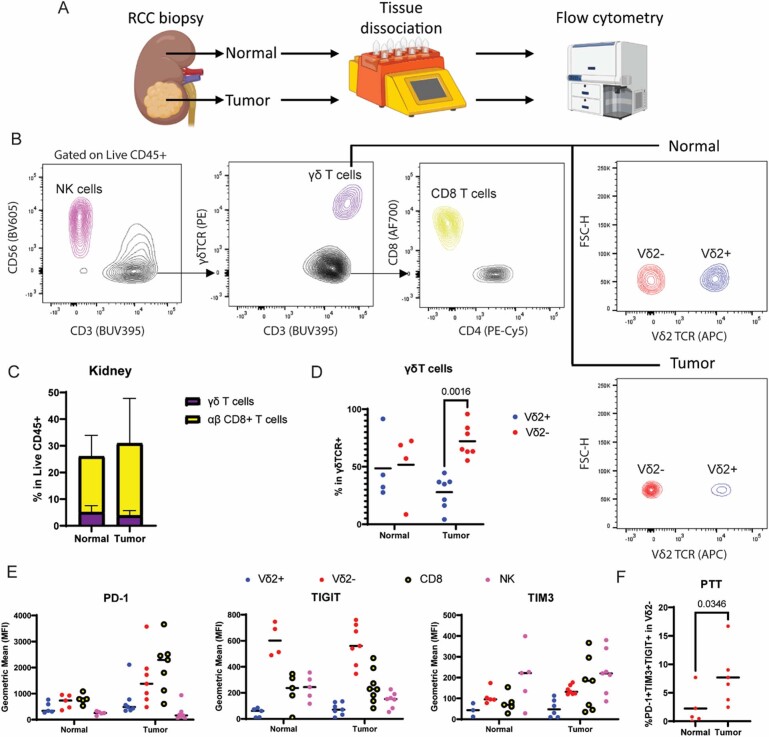
Extended Data Fig. 1. Characterization of αβ and γδ T cells in normal and RCC tumor samples.
a. Schematic diagram showing the workflow performed on healthy kidney and RCC tumor samples. b. Gating strategy in flow cytometry analysis of 5 healthy tissue and 7 RCC samples (left). Contour plots showing expression of lineage markers CD56 (NK), CD3 and γδTCR (T cells), CD8 vs CD4 (αβ T cells), and Vδ2 TCR in normal vs tumor. c. Stacked bar plot showing cell frequencies of αβ and γδ T cells in normal and RCC samples. No significance found by one-sided Mann-Whitney test for each cell type. Error bars represent standard deviation. d. Percentage of Vδ2+ and Vδ2- subsets within overall γδ T cells in normal and tumor samples. Each dot represents one sample. Significance assessed by 2-way ANOVA multiple comparison test. e. Expression of PTT markers PD-1, TIGIT and TIM3 in effector containing subsets γδ T cells, αβ T cells and NK cells from normal and tumor samples. f. Dot plot showing frequency of PTT triple positive Vδ2- T cells in normal and tumor samples. Significance assessed by one-sided Mann-Whitney test. Created with BioRender.com.

