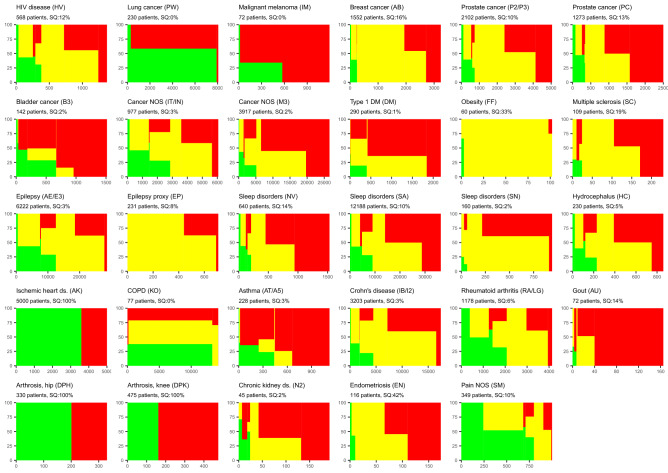
Fig. 3.
Distribution of PRO-algorithm outcomes. X-axis: number of questionnaires (algorithm outcomes), Y-axis: cumulative proportion of outcome colors. Prior to plotting, questionnaires were ordered patient-wise by outcome severity group (cf. Table 1), so that questionnaires from patients with least severe outcomes (solely green outcomes) appear on the left and questionnaires from patients with the most severe outcomes (solely red outcomes) on the right. SQ: Singleton questionnaires i.e., questionnaires from patients who so far have answered only one questionnaire and thus can possess no variation. (Color figure online)

