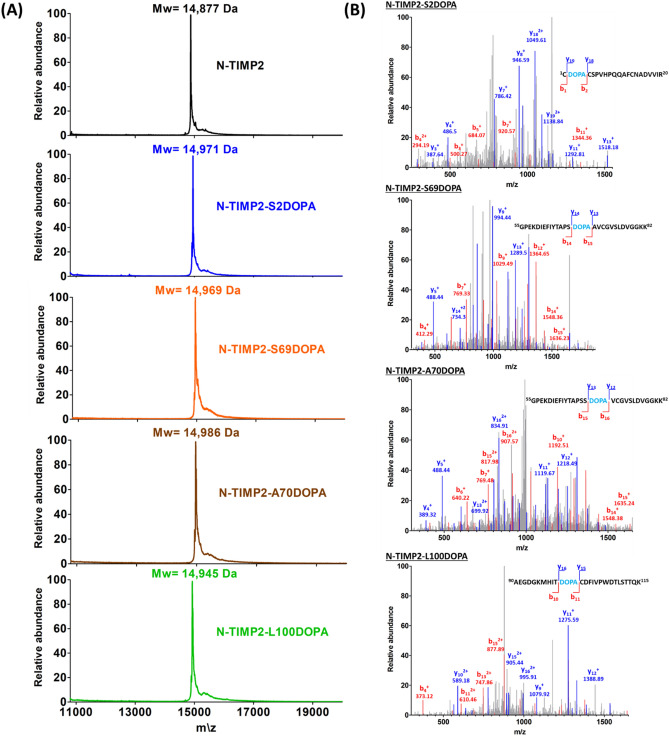
Figure 3.
Mass spectrometry analysis of the N-TIMP2-DOPA variants. (A) MALDI-TOF analysis of N-TIMP2-S2DOPA (expected mass: 14,975 Da), N-TIMP2-S69DOPA (expected mass: 14,975 Da), N-TIMP2-A70DOPA (expected mass: 14,991 Da) and N-TIMP2-L100DOPA (expected mass: 14,945 Da), confirming the correct mass differences of ~ 92, ~ 92, ~ 108 and ~ 66 Da, respectively, between each variant and the parental N-TIMP2 (upper row, expected mass: 14,883 Da). In all cases, the differences between expected (theoretical) and observed values were less than 0.1%. (B) LC–MS/MS analysis of N-TIMP2-S2DOPA, N-TIMP2-S69DOPA, N-TIMP2-A70DOPA and N-TIMP2-L100DOPA confirming the incorporation of DOPA at a particular position in each clone.

