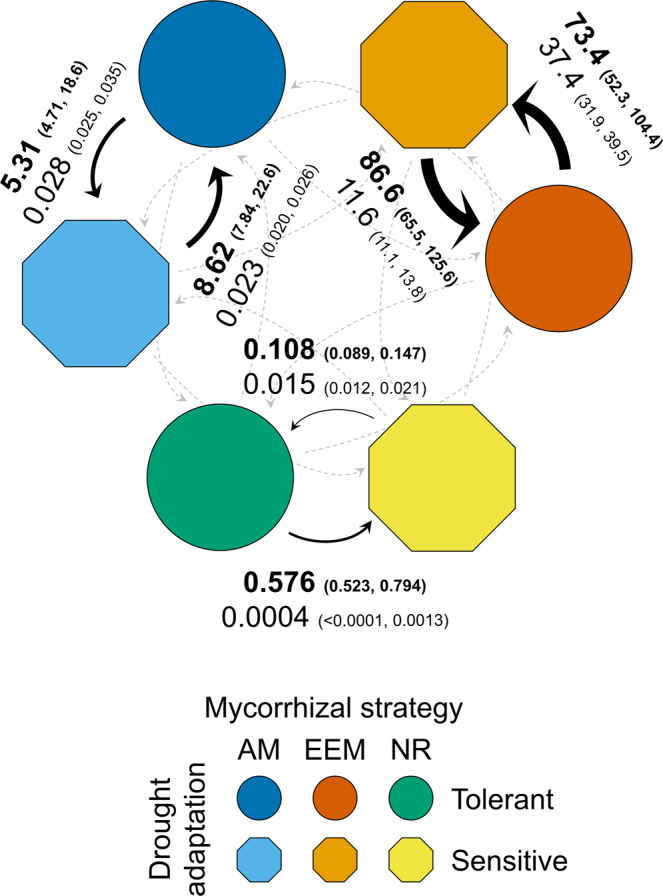
Fig. 2. Transition rates of the dependent evolution for plant mycorrhizal strategy and drought adaptation.

Values are averages of the best rate estimates (per mega-annum; Ma) for the evolutionary transitions between a plant mycorrhizal strategy and drought adaptation state to another based on the best rate estimates obtained from the individual models best fitted to the dataset v1 to v6. The 95% confidence intervals for the best rate estimates are shown between brackets. Values provided in bold and regular font correspond to rates in the hidden rate category one (R1) and two (R2), respectively. The width of the arrows is proportional to rates in R1. A dotted gray arrow indicates that the rate is lower than 0.01 transitions per Ma. The average values of the best estimations for all the evolutionary transition rates and the respective 95% confidence intervals are shown in Table 2. The best rate estimates and the 95% confidence intervals for each dataset version are shown in Fig. 3 and Supplementary Table 1. For details on the assembly of dataset versions, see Table 3 and Methods. The sample size of extant plant states in each dataset version is provided in Table 4.
