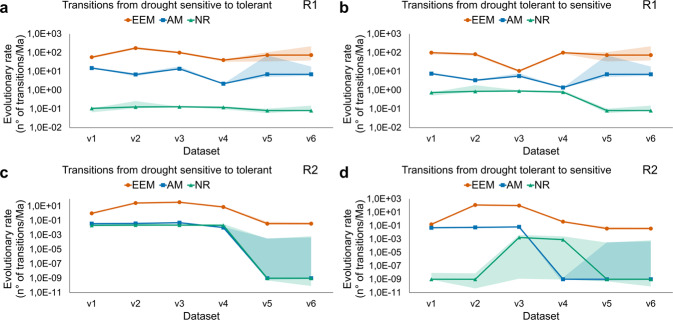
Fig. 3. Sensitivity analysis on the rates of evolutionary transitions between drought adaptation states within a given mycorrhizal strategy state.
The variation of the best rate estimates in logarithmic scale is shown, as determined by the models best fitted to dataset v1 to v6, for the evolutionary transitions from drought-sensitive to tolerant (a) and drought tolerant to sensitive (b) in the hidden rate category one (R1), and from drought-sensitive to tolerant (c) and drought tolerant to sensitive (d) in the hidden rate category two (R2), as influenced by the arbuscular mycorrhizal (AM) state, the combined ectomycorrhizal and ericoid mycorrhizal (EEM) state, or the naked root (NR) state, i.e., non-mycorrhizal alone (dataset v5 and v6) or together with the facultatively AM plants (dataset v1 to v4). The assembly of datasets v1 to v6 is summarized in Table 3 and described in the Methods. Shaded areas around the transition rates represent the 95% confidence intervals for the best rate estimates. The sample size of extant plant states in each dataset version is provided in Table 4.

