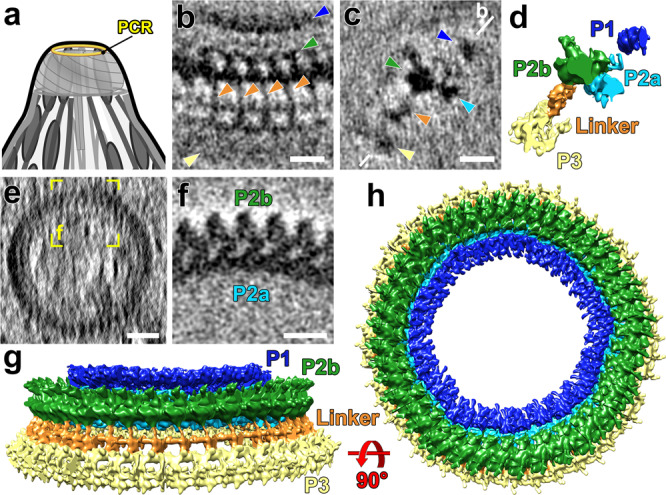
Fig. 5. Subtomogram averages of the PCRs show three rings and a linker.

a Cartoon of the apical complex highlighting the location of the PCRs. b–d Tomographic slices (b and c), and isosurface rendering of the averaged PCR repeats (d) viewed in the tangential (b) and longitudinal (c and d) orientations, showing different components of the PCR including the apical P1 (highlighted by blue arrowheads), P2a (cyan), P2b (green), P3 (yellow), and the linker (orange) between P2b and P3. The white line in (c) indicates the location of the slice in (b). e, f Cross-sectional slices from a raw tomogram (e) and the averaged PCR repeats (f) show that the round PCR P2 ring is composed of an outer and an inner ring, P2a and P2b, respectively. The yellow square in (e) indicates the orientation and location of the subtomogram average displayed in (f). g, h Isosurface renderings show the complete PCRs by assembling the averaged repeats back to the full tomogram. Scale bars, 20 nm (in b, c, f); 50 nm (in e).
