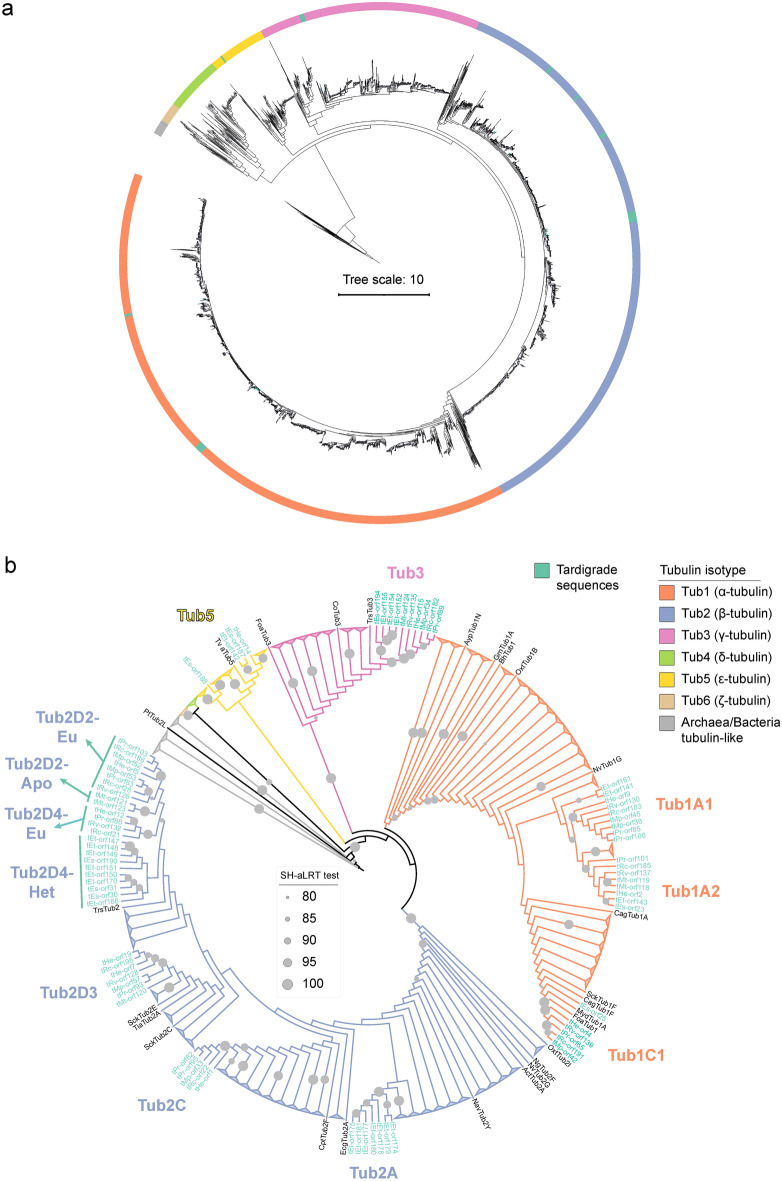
Figure 2.
Identification of tardigrade tubulin isoforms. (a, b) Different visualizations of an identical phylogenetic tree computed from an alignment of the curated tardigrade tubulin dataset with Findeisen et al.39 dataset. (a) Maximum likelihood method (IQ-TREE). (b) Maximum likelihood method (IQ-TREE), non-tardigrade tubulins branches collapsed and branch lengths ignored to simplify visualization. Grey circles indicate SH-aLRT test score69. The legend describes color coding. See also Supplementary data 3 and Supplementary Table 1.

