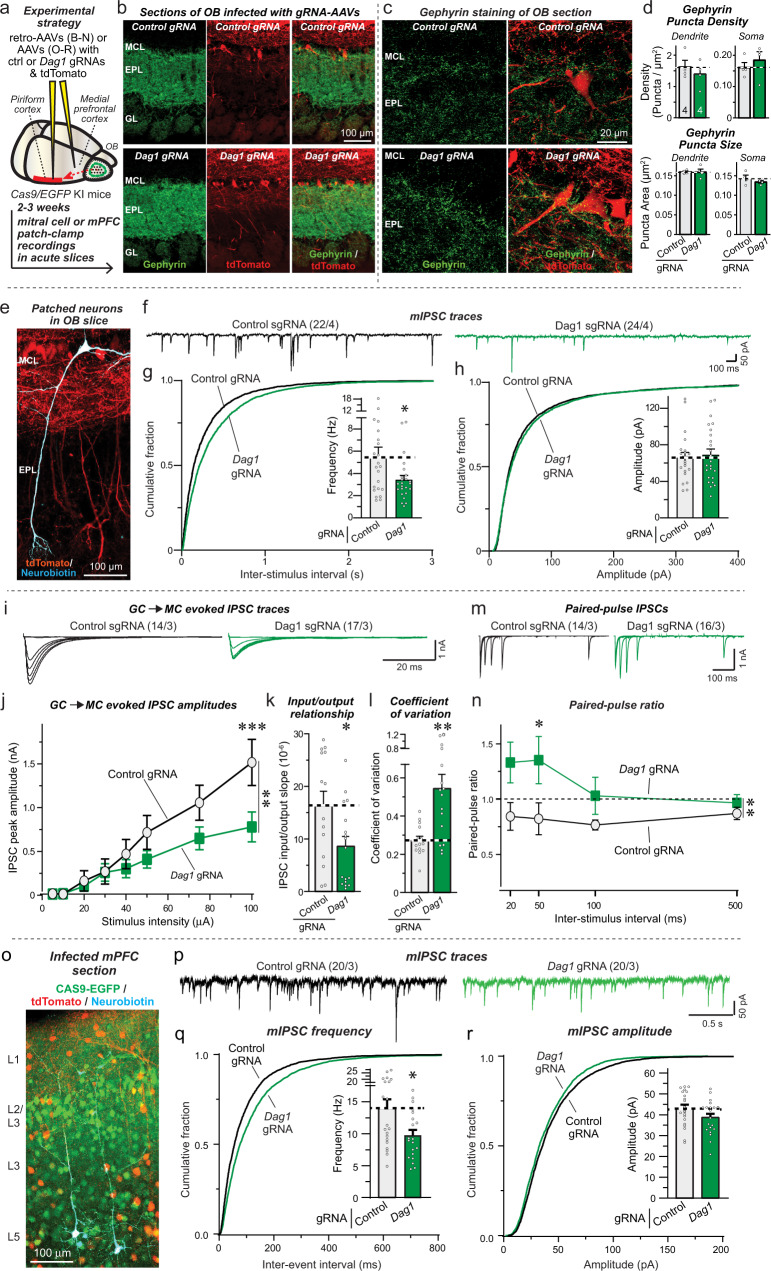
Fig. 9. Dystroglycan (Dag1) deletion in mitral cells of the OB and in the mPFC suppresses inhibitory synaptic transmission.
a Mitral cells are infected with control or Dag1 gRNAs and tdTomato by projection-specific labeling through retro-AAVs injected in the piriform cortex. b Representative OB sections stained for gephyrin (green) and for tdTomato (red). c, d Dystroglycan deletion does not change the density or size of gephyrin-positive synapses (green) co-localized with tdTomato-expressing mitral cells (c, sample images; d, summary of puncta densities (top) and puncta size (bottom)). e Representative image of a mitral cell filled with neurobiotin (blue) and expressing tdTomato via AAVs (red). f–h Dystroglycan (Dag1) deletion decreases the mIPSC frequency in mitral cells (f, representative mIPSC traces; g, h cumulative probability of the mIPSC interevent intervals and amplitudes, insets: summary of the mIPSC frequency and amplitudes). i–k Dystroglycan (Dag1) deletion suppresses the IPSC amplitude at GC→MC synapses (i, representative IPSC traces; j, summary of input/output amplitudes; k, summary of the input/output curve slopes). l Mitral cell-specific dystroglycan (Dag1) deletion increases the coefficient of variation of evoked IPSCs. m, n Dystroglycan (Dag1) deletion induces a large increase in the paired-pulse ratio (m, representative traces; n, summary plot of the paired-pulse ratio). o–r Dystroglycan deletion in the mPFC decreases the mIPSC frequency monitored in Layer 5 pyramidal neurons (o, representative image of an mPFC section; p, representative mIPSC traces; q–r, cumulative probability of the mIPSC interevent intervals and amplitudes, insets: summary of the mIPSC frequency and amplitudes)). Numerical data are means ± SEM; n’s (animals (d) or cells/experiments (the rest)) are indicated in the summary graph bars (d) or above the sample traces (f, i, m, and p) and apply to all graphs in an experimental series with b–d belonging to the same series. Statistical analyzes were performed using two-tailed unpaired t-test in d, g, h, k, l, q, r, and by two-way ANOVA in j & n with Bonferroni multiple hypothesis testing, with *p < 0.05, **p < 0.01, and ***p < 0.001. Source data and statistical results for all experiments are provided within the Source Data file.

