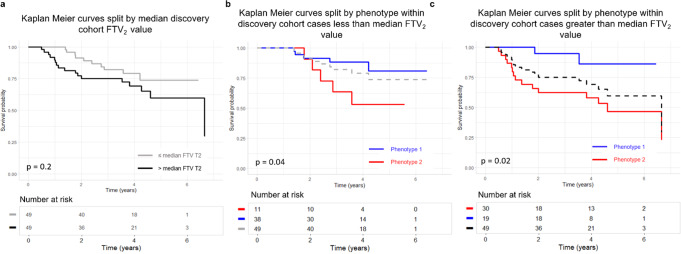
Fig. 3. Survival Analysis for the Discovery Cohort Split by Median Functional Tumor Value.
Kaplan Meier recurrence free survival (RFS) curves for the discovery cohort split by median functional tumor volume at T2 (FTV2) value (n = 100) (a) versus split by phenotype within strata of less than median FTV2 (n = 51) (b) and greater than median FTV2 (n = 49) (c). RFS split by above/below median FTV2 does not show p < 0.05 for separation. Within each stratum of FTV2, the split on phenotype is significant (b and c).

