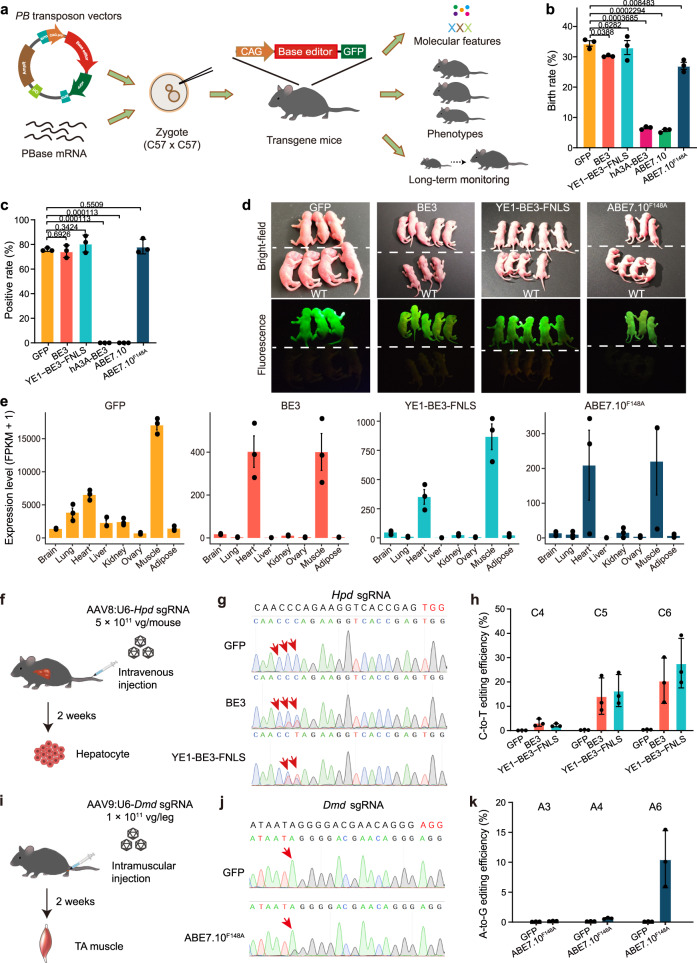
Fig. 1. Generation of GFP, BE3, YE1-BE3-FNLS, and ABE7.10F148A mouse lines.
a Schematic diagram of the Systematic evaluation Approach For gene Editing tools by Transgenic mIce (SAFETI). b Birth rate of F0 mice injected with GFP, BE3, hA3A-BE3, YE1-BE3-FNLS, ABE7.10 or ABE7.10F148A. Birth rate: the percentage of number of live births divided by the population size of transferred embryos. The birth rates were calculated for three injections, and the total numbers of transferred embryos were 265, 258, 259, 320, 302 and 265 in GFP, BE3, hA3A-BE3, YE1-BE3-FNLS, ABE7.10 and ABE7.10F148A, respectively. c The proportion of F0 mice with successful integration of the transgenes (positive rate). The positive rates were calculated for three transplantations, and the total number of births were 91, 78, 86, 21, 17 and 72 in GFP, BE3, YE1-BE3-FNLS, hA3A-BE3, ABE7.10 and ABE7.10F148A, respectively. d Bright-field and fluorescence images of newborn wild-type (WT) mice and mice expressing GFP, BE3, YE1-BE3-FNLS, or ABE7.10F148A. e The expression levels of transgenes in the indicated tissues. FPKM, Fragments Per Kilobase Million. f Schematic showing the experimental procedure for delivery of Hpd sgRNA through AAV8 into the CBE transgenic mice by tail-vein injection. g Representative Sanger sequencing chromatograms of PCR amplicons spanning the Hpd gRNA target site are shown for GFP, BE3, and YE1-BE3-FNLS transgenic mice. Red arrows mark the targeted cytosine. h The C-to-T base editing efficiency at the Hpd target site in GFP, BE3, and YE1-BE3-FNLS mice assessed by deep sequencing. i Schematic showing the experimental procedure for delivery of Dmd sgRNA through AAV9 into the ABE transgenic mice by intramuscular injection. j Representative Sanger sequencing chromatograms of PCR amplicons spanning the Dmd target site are shown for GFP and ABE7.10F148A mice. Red arrows mark the targeted adenine. k The A-to-G base editing efficiency at the Dmd target site (A3, A4, A6) in GFP and ABE7.10F148A mice assessed by deep sequencing. Data are presented as means ± SEM (n = 3 biologically independent samples). P values were calculated by two-sided, unpaired t-test. Source data are provided as a Source Data file.

