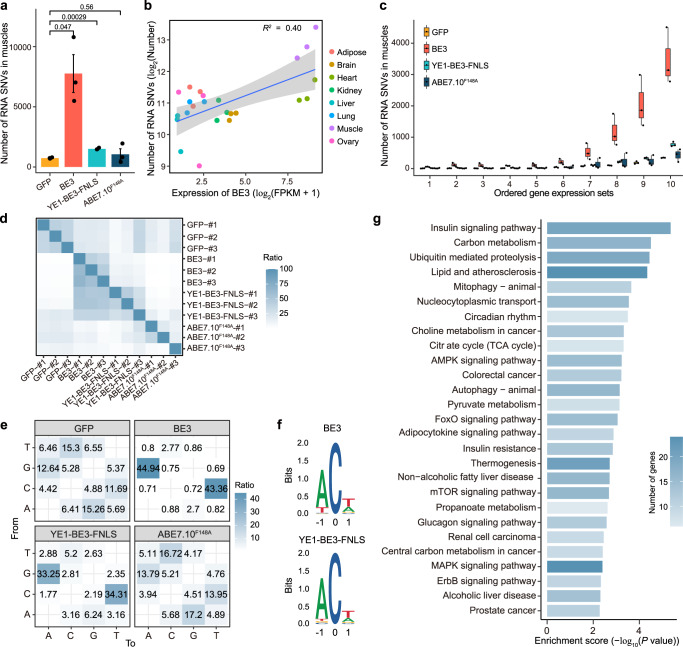
Fig. 3. RNA off-target mutations in the GFP, BE3, YE1-BE3-FNLS and ABE7.10F148A transgenic mice.
a Comparison of the numbers of RNA SNVs in muscles of the GFP, BE3, YE1-BE3-FNLS and ABE7.10F148A transgenic mice. Data are presented as mean ± SEM (n = 3). P values were calculated by two-sided unpaired t-test. b Correlations between the numbers of RNA SNVs and the expression levels of BE3 in diverse tissues of the BE3 transgenic mice. c Correlations between the numbers of RNA SNVs and gene expression levels in the muscles of GFP, BE3, YE1-BE3-FNLS, or ABE7.10F148A transgenic mice. The gene expression levels were sorted by FPKM, and were equally divided into 10 sets in the order of expression levels. d The ratio of shared RNA SNVs between any two samples from GFP, BE3, YE1-BE3-FNLS, and ABE7.10F148A groups. The proportion in each cell is calculated by the number of overlapping RNA SNVs between two samples divided by the number of RNA SNVs in the row. n = biologically independent samples. e Distribution of mutation types in muscles of the GFP, BE3, YE1-BE3-FNLS, and ABE7.10F148A mice. The number indicates the percentage of a certain type of SNVs among all SNVs. f Sequence logos derived from RNA SNVs in muscles of the BE3 and YE1-BE3-FNLS mice. Analysis was performed on generated RNA-seq data using cDNA, and thus every T depicted should be considered a U in RNA. g Kyoto Encyclopedia of Genes and Genomes (KEGG) pathway enrichment analysis of the RNA SNVs detected in muscles of the BE3 transgenic mice. Genes with a change in expression > 2.0-fold compared with the baseline value and with a P value < 0.05 were selected for analysis. Source data are provided as a Source Data file.

