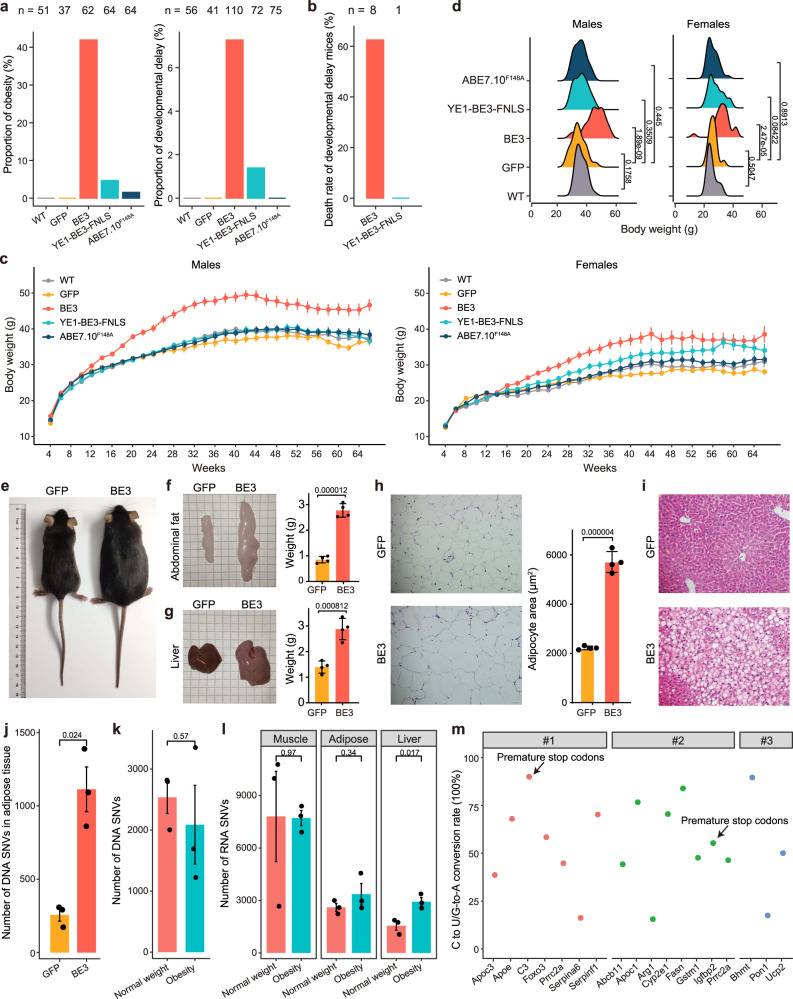
Fig. 4. The phenotypic effects of BE3, YE1-BE3-FNLS and ABE7.10F148A in the transgenic mice.
a The proportions of mice with obesity at 30-week-old or developmental delay at 8-week-old in WT, BE3, YE1-BE3-FNLS and ABE7.10F148A groups. Obesity: the body weight greater than the mean + 3 SEM of WT group; Developmental delay: the body weight lower than the mean − 3 SEM of WT group. b Death rate of developmental delay mice before 12 weeks in BE3 and YE1-BE3-FNLS groups. c The body weight measurements of the WT (n > 13 males and 11 females), GFP (n > 12 males and 9 females), BE3 (n > 22 males and 16 females), YE1-BE3-FNLS (n > 20 males and 12 females) and ABE7.10F148A (n > 22 males and 21 females) mice every two weeks from 4 to 66 weeks at age. Data are presented as mean ± SEM. P value statistics are shown in Supplementary Fig. 7e and listed in Supplementary Data. 1. d The distribution of body weights of male and female mice in five groups at 30-week-old. e Representative photos of 30-week-old male mice in GFP and BE3 groups. f, g Representative photos and weights of abdominal fat and liver tissues in GFP and BE3 mice (30-week-old, male). h H&E staining of abdominal fat, and morphometric analysis of the area of abdominal adipocytes in GFP and BE3 mice. f–h, Data are presented as mean ± SEM (n = 4). P values were calculated by two-sided unpaired t-test. i H&E staining of liver tissues in GFP and BE3 mice. j Number of DNA SNVs in abdominal fat tissues from GFP and BE3 groups. k Number of DNA SNVs in BE3 obesity and normal weight mice. l Number of RNA SNVs in muscle, adipose, liver from BE3 obesity and normal weight mice. j–l Data are presented as mean ± SEM (n = 3). P values were calculated by two-sided unpaired t-test. m Premature stop codons and non-synonymous of genes induced by off-target C-to-T editing in obesity mice that are implicated in obesity. Source data are provided as a Source Data file.

