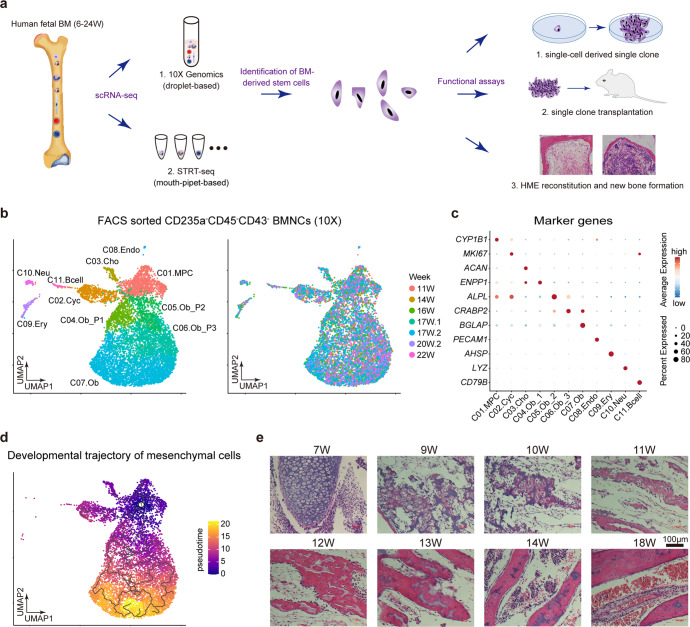
Fig. 1.
Expression landscape of human fetal BM stromal cells. a Diagrammatic sketch of the current study. b UMAP showing the clustering (left) and week information (right) of all FACS-sorted CD235a-CD45-CD43- nucleated cells sampled from the human fetal bone marrow, which were sequenced by 10x Genomics scRNA-seq technique. c Dotplot showing the expression patterns of representative marker genes in each major cluster identified in Fig. 1b. The color key from blue to red indicates low to high expression levels, respectively. Dot size indicates the percent of cells expressing a certain gene. d Developmental trajectory of mesenchymal cells inferred by monocle 3 algorithm. e H&E staining of femur sections from different embryonic stages

