Fig. 2.
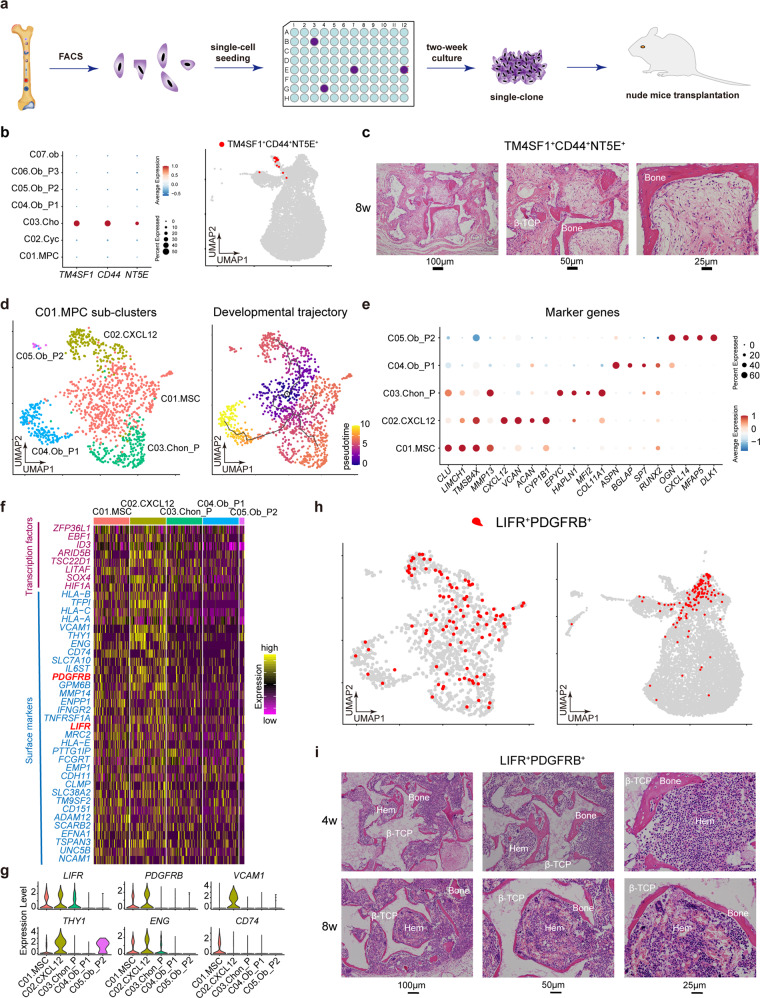
Heterogeneity of MSCs in human fetal BM. a Study overview for nude mice transplantation. b Dotplot (left) and UMAP (right) showing the specific expression of gene combination of TM4SF1, CD44 and NT5E in chondrocytes. The color key from blue to red indicates low to high expression levels, respectively. Dot size indicates the percent of cells expressing a certain gene. c Abundant new bones were formed after 8 weeks transplantation of single clone derived from single primary TM4SF1+CD44+CD73+/CD45-CD31-CD235a- cell. d UMAP showing the clustering result (left) and developmental trajectory (right) of MPCs identified in Fig. 1b. e Dotplot showing expression levels of representative marker genes in each cluster identified in Fig. 2d. f Heatmap showing the differentially expressed transcription factors and surface markers of C01.MSC and C02.CXCL12. The color key from purple to yellow indicates low to high expression levels, respectively. g Violin plots showing the expression levels of potential surface markers for C01.MSC and C02.CXCL12. h UMAP showing the specific expression of gene combination of LIFR and PDGFRB in C01.MSC and C02.CXCL12. i Hematopoietic cell clusters (hem) appeared at 4 weeks and matured at 8 weeks after transplantation of single clone derived from single primary LIFR+PDGFRB+/CD45-CD31-CD235a- cell. Abundant new bones were formed after 4 weeks transplantation. β-TCP: hydroxyapatite carrier

