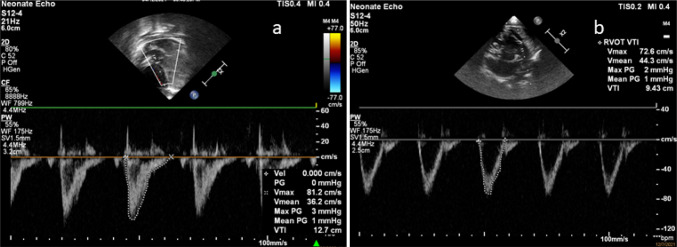
Fig. 3.
Image showing Left ventricular and right ventricular output. a Left ventricular velocity time Integral measured in apical view with LVOT using PW Doppler (VTI): shown in the figure as 12.7 cm. b Right ventricular velocity time Integral measured in short-axis view using PW doppler (VTI): shown in the figure as 9.3 cm. Stroke volume = cross sectional area × velocity time integral

