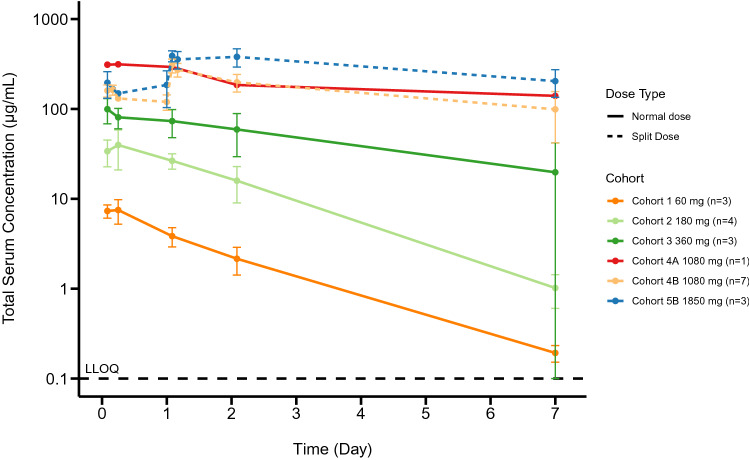
Fig. 1.
Mean (±SD) RO7297089 serum concentration–time profiles following the first dose in patients administered a flat dose (Cohorts 1-4A) 60–1080 mg or a split dose (Cohorts 4B & 5B) 1080 and 1850 mg QW. Dashed line at the bottom indicates the lower limit of quantitation. PK data from 6 patients were excluded from the plot due to not receiving the full dose, missed sample, and an obvious outlier with Ctrough concentration higher than concentration at the end of infusion

