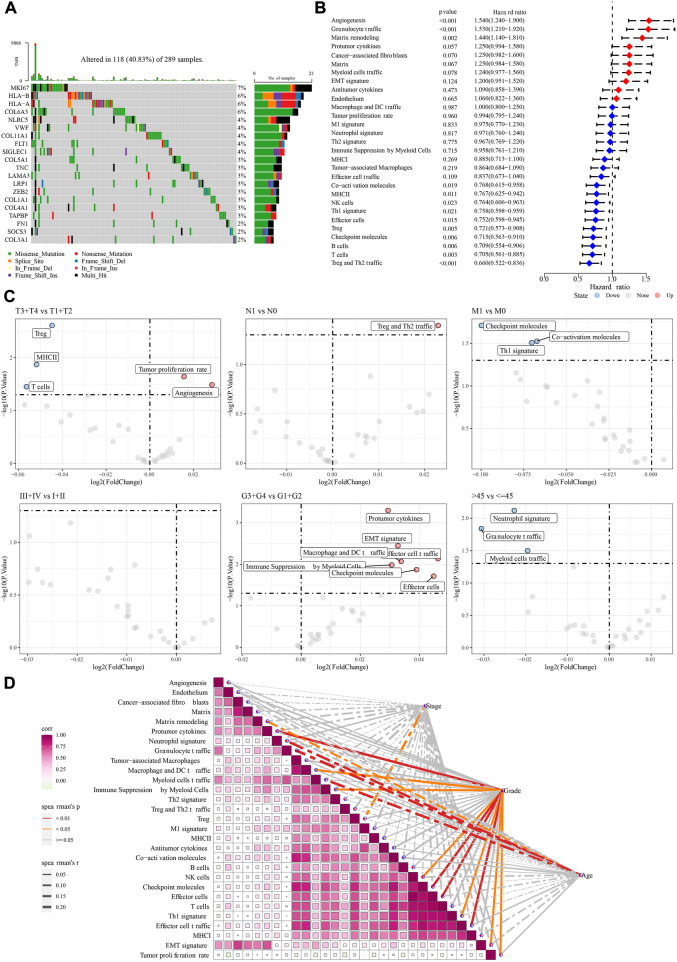
FIGURE 1.
The association between 29 TME gene signatures and clinical characteristics in TCGA-CESC patients. (A): Top20 TME related genes mutations in TCGA-CESC dataset. (B): Univariate cox regression analysis of 29 TME gene signatures. (C): The differences of 29 TME gene signatures among clinical feature grouping. (D): Correlation between 29 TME gene signatures with each other as well as stage, grade, and age. *p < 0.05; **p < 0.01; ***p < 0.001; ****p < 0.0001; ns: no significance.

