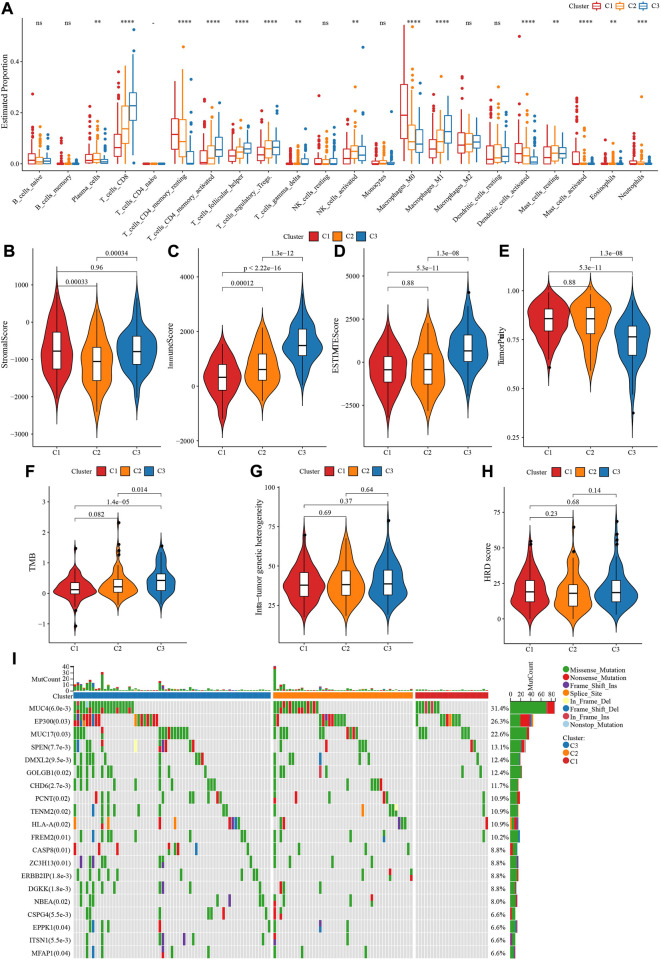
FIGURE 3.
Immune infiltration analysis among three TME subtypes. (A) CIBERSORT analysis of 22 immune cells distribution among three TME subtypes. (B) The difference of StromalScore among three TME subtypes. (C) The difference of ImmuneScore among three TME subtypes. (D) The difference of ESTIMATEScore among three TME subtypes. (E) The difference of TumorPurity among three TME subtypes. (F) The difference of TMB among three TME subtypes. (G) The difference of Intra-tumor genetic heterogeneity among three TME subtypes. (H) The difference of HRD score among three TME subtypes. (I) Somatic cell mutation among three TME subtypes. ***p < 0.001; ****p < 0.0001.

