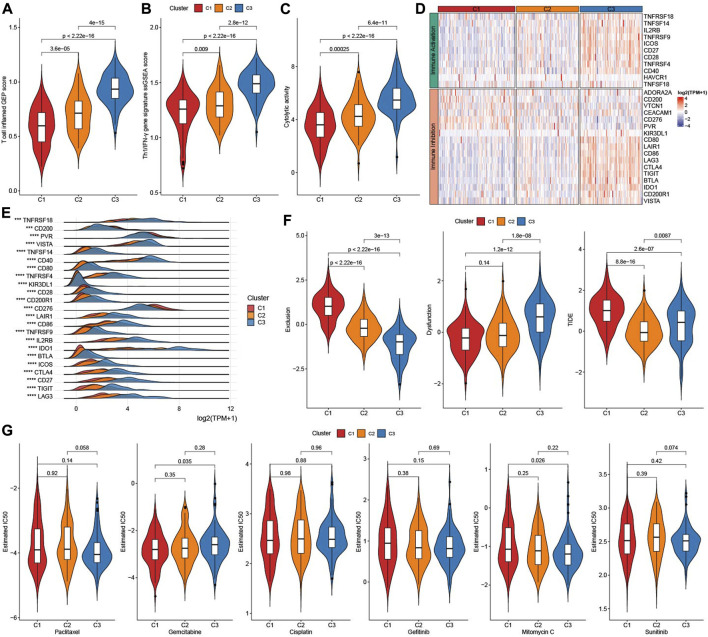
FIGURE 5.
Immunotherapy analysis. (A) The difference of T cell inflamed GEP score among three TME subtypes. (B) The difference of Th1/IFNγ score among three TME subtypes. (C) The difference of Cytolytic activity score among three TME subtypes. (D) Heatmap of immune checkpoints genes among three TME subtypes. (E) the expressions of immune checkpoints genes among three TME subtypes. (F) TIDE analysis among three TME subtypes. (G) The box plots of the estimated IC50 for Paclitaxel, Gemcitabine, Cisplatin, Gefitinib, Mitomycin C, and Sunitinib among three TME subtypes.

