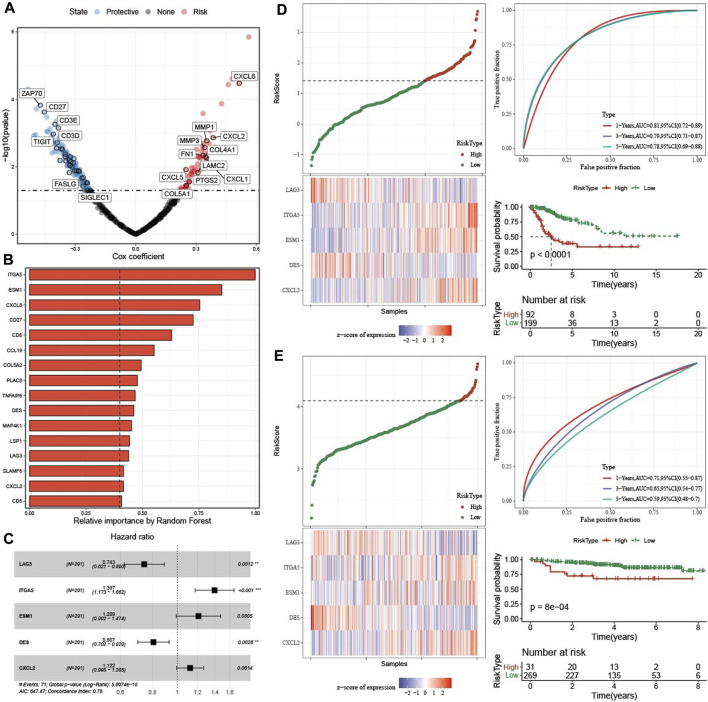
FIGURE 6.
Construction and validation of prognosis model. (A) Univariate cox regression analysis of TME related genes. (B) The 16 most predictive genes selected by random survival forest. (C) Univariate cox regression analysis of five hub genes. (D) The distribution of RiskScore, expression of five hub genes in TCGA-CESC dataset. ROC analysis and AUC of RiskSore in TCGA-CESC dataset. KM survival curve of high group and low group in TCGA-CESC dataset. (E) The distribution of RiskScore, expression of five hub genes in GSE44001 dataset. ROC analysis and AUC of RiskSore in GSE44001 dataset. KM survival curve of high group and low group in GSE44001 dataset.

