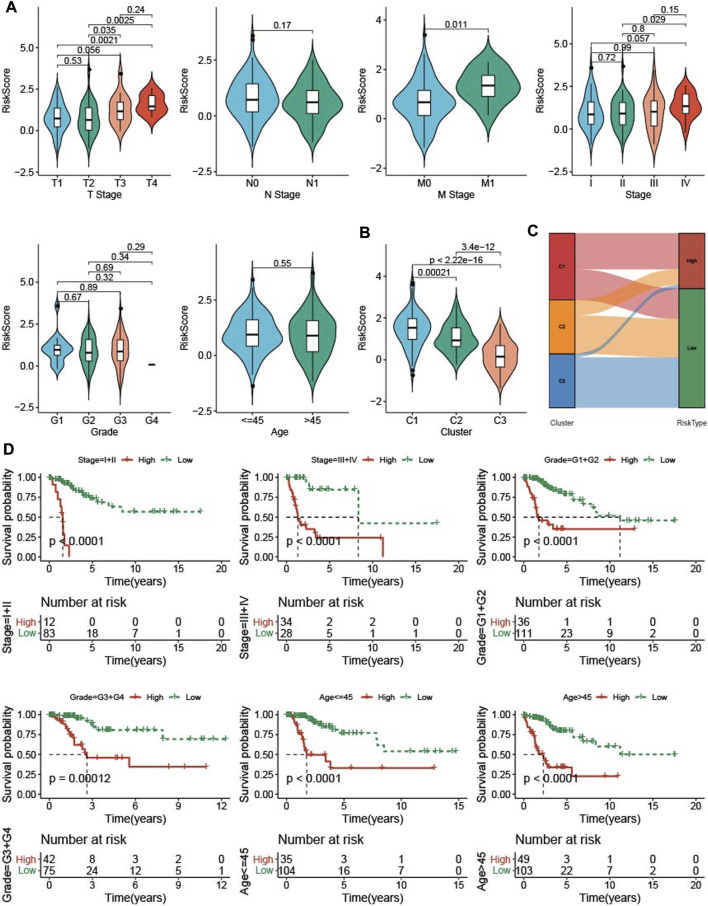
FIGURE 7.
The RiskScore differences on samples with clinical features. (A) the differences of RiskScore in patients with various clinical features including T stage, N stage, M stage, stage, grade, and age. (B) the differences of RiskScore among three TME subtypes. (C) Matches of two subtypes and high- and low-groups. (D) KM survival of patients in high group and low group with various clinical features divided by RiskScore.

