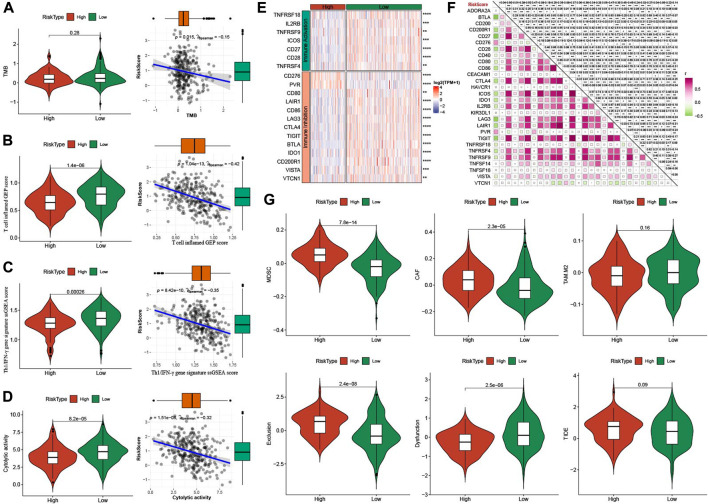
FIGURE 9.
Analysis of immunotherapy between high- and low-group. (A) TMB differences between high- and low-group. The association between RiskScore and TMB. (B) T cell inflamed GEP score differences between high- and low-group. The association between RiskScore and T cell inflamed GEP score. (C) Th1/IFNγ gene signature score differences between high- and low-group. The association between RiskScore and T cell inflamed GEP score. (D) Cytolytic activity differences between high- and low-group. The association between RiskScore and Cytolytic activity. (E) The expression of immune checkpoints genes between high- and low-group. (F) The association between RiskScore and immune checkpoints genes. (G) TIDE analysis between high- and low-group. *p < 0.05; **p < 0.01; ***p < 0.001; ****p < 0.0001; ns: no significance.

