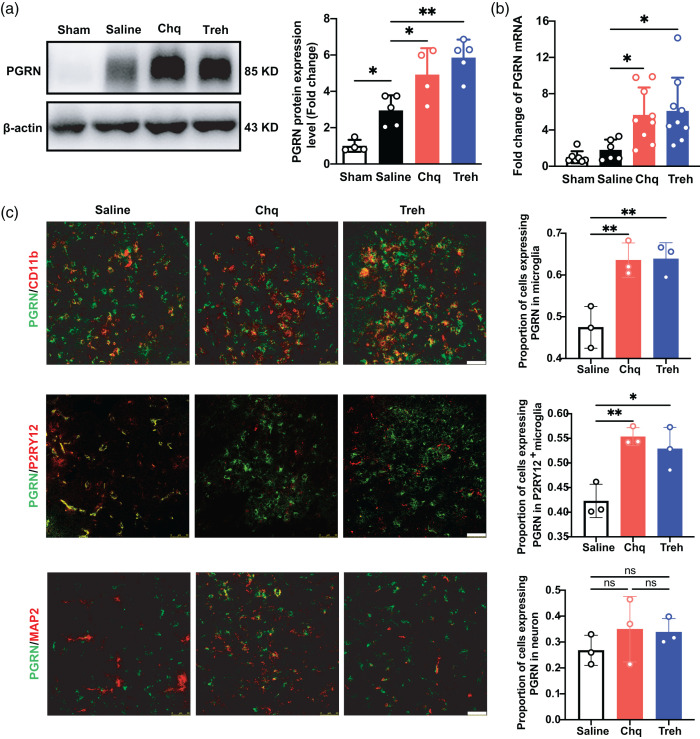
Figure 2.
Progranulin expression increased in the chloroquine and trehalose treatment groups after tMCAO. (a) Western blot and the quantification of PGRN in sham group and saline, Chq and Treh group at 3 days after tMCAO, n = 4–5 per group. (b) Quantitative of RT-PCR analysis for the expression of PGRN in sham group and saline, Chq and Treh group at 3 days after tMCAO. n = 6–9 per group. c. Representative Confocal imaging (left) showed the co-localization of PGRN (green) with neurons (MAP2, red) and microglia (CD11b/P2RY12, red) in saline, Chq and Treh group at 3 days after tMCAO, Scale bar = 50 μm. Proportion of cells expressing PGRN in microglia and neuron (right), n = 3 per group. Data are presented as mean ± SD. *p < 0.05, **p < 0.01, ***p<0.001.

