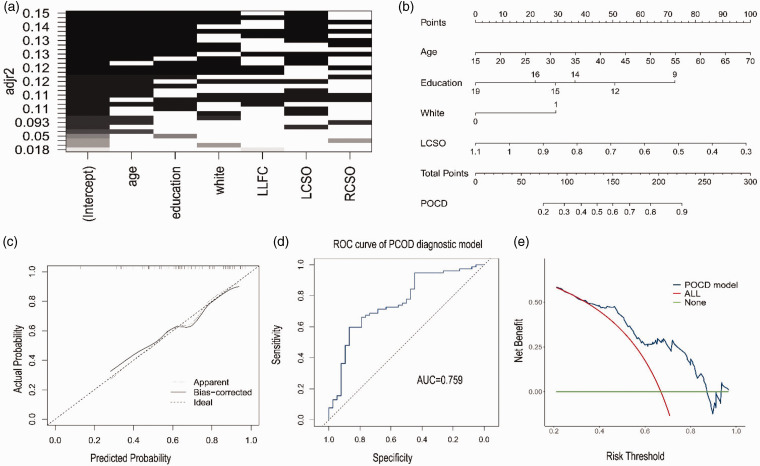
Figure 3.
Risk factors analysis of cognitive function. (a) The optimal subset is determined according to the adjusted maximum value of R-squared. Age, education, white matter (Fezakas scale) and rCBF of left centrum semi-oval (LCSO) were selected as potential risk factors of cognitive impairment. (b) Characteristics in the nomogram to predict probability of cognitive function in MMD patients without stroke. (c) Calibration curve of the predictive nomogram for probability of cognitive function in MMD patients without stroke. (d) The area under the curve (AUC) of a receiver operating curve (ROC) and (e) Decision curve analysis (DCA) was used to assess net clinical benefit of the model.

