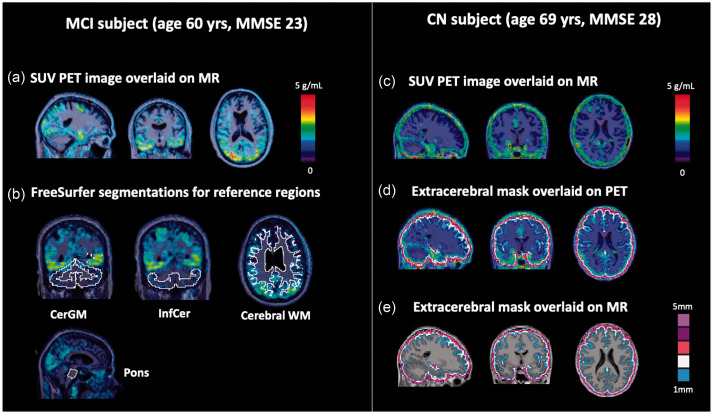
Figure 1.
Example [18F]MK-6240 PET images and segmentations for the evaluated reference and extracerebral regions. (a) SUV90–110 PET image for a MCI subject (SUVRCerGM = 2.1 across target regions) showing characteristic tau uptake pattern in the temporal and occipital lobes. (b) FreeSurfer segmentations of the candidate reference regions overlaid on the SUV90-110 image. (c) SUV90-110 PET image for a CN subject (SUVRCerGM = 1.2 across target regions) showing high extracerebral signal (SUVRCerGM = 1.4), especially surrounding the brain hemispheres and the cerebellum. Extracerebral masks overlaid on SUV90-110 PET (d) and MR (e) images.

