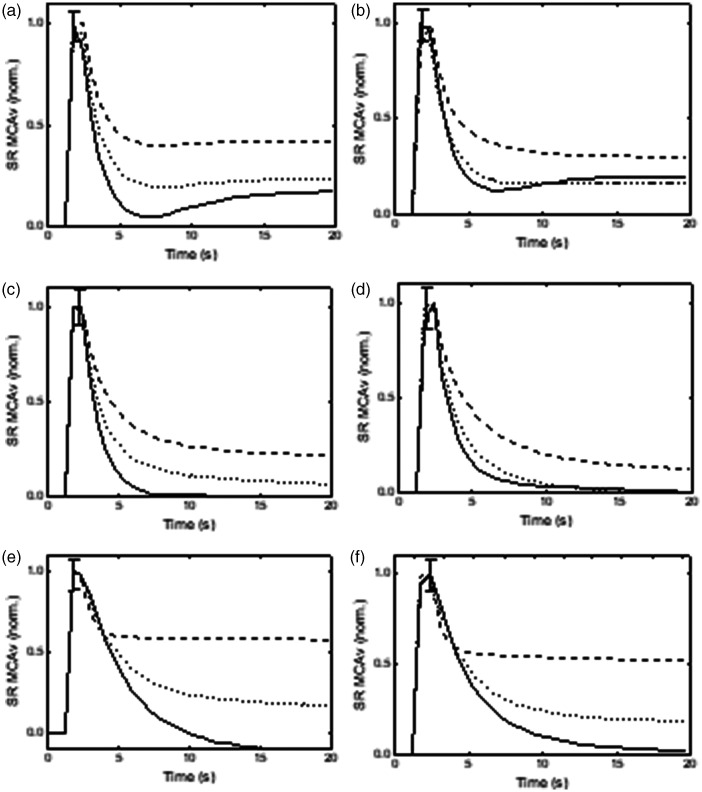
Figure 3.
Population averages of normalized middle cerebral artery velocity step responses (SRMCAv) estimated from the integrated positive (continuous line) and negative (dashed line) derivatives of mean arterial blood pressure (MAP), compared with the responses obtained with the original MAP signal (dotted line), for the right (a,c,e) and left (b,d,f) hemispheres. (a,b) sitting position, (c standing position and (e,f) repeated squat-stand maneuver at 0.05 Hz. The error bars correspond to the largest ±1 SE of the three responses, at the point of occurrence.

