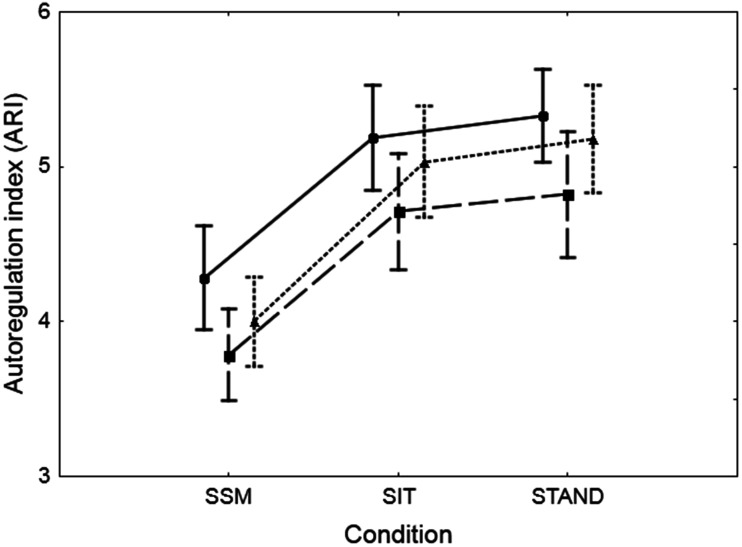
Figure 4.
Population (n = 43) mean values of the autoregulation index (ARI) averaged for both hemispheres, estimated from the original mean arterial blood pressure (BP) signal (dotted line) and the integrated positive (continuous line) and negative (dashed line) derivatives of BP. The error bars correspond to ±1 SE. Both effects of condition (SSM, SIT, STAND) and estimation source were highly significant (p < 0.0001) in a 2-way ANOVA, without the interaction of effects.

