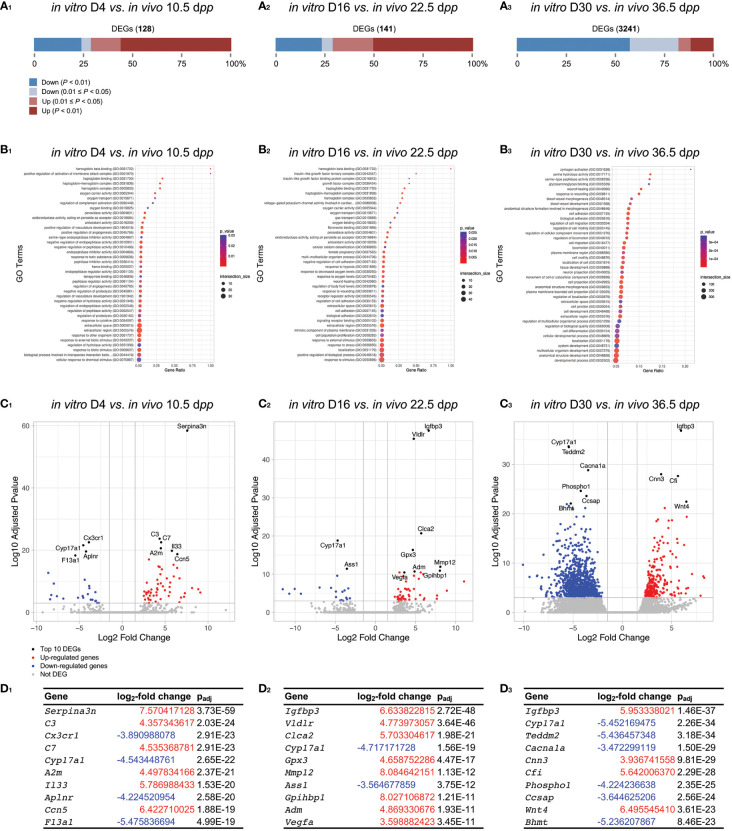
Figure 7.
Gene-level differential expression analysis between in vitro and in vivo age-matched testicular samples. (A) The proportion of significantly DEGs are shown between in vitro and in vivo testicular tissue samples for D4 vs. 10.5 dpp (A1), D16 vs. 22.5 dpp (A2), and D30 vs. 36.5 dpp (A3). The number of DEGs for each comparison is available in order to have an appreciation of the difference in gene expression between the two conditions compared. (B1-3) Corresponding GO enrichment dot plot. The 40 GO processes with the largest gene ratios are plotted in order of gene ratio. The size of the dots represent the number of genes in the significant DEGs associated with the GO Terms and the color of the dots represent the padj values. (C1-3) Volcano plots compare the amount of gene expression change to the significance of that change (here plotted as the log10 transformation of the multiple test padj value), with each point representing a single gene. The top 10 gene candidates are highlighted in black and by text labeling. The two marginal plots showing the distributions of the log2-fold changes and negative log10 padj values are used to show cutoff choices and trade-offs. (D1-3) Top ten DEGs with corresponding log2-fold change and padj value. DEGs, differentially expressed genes; dpp, days postpartum.

