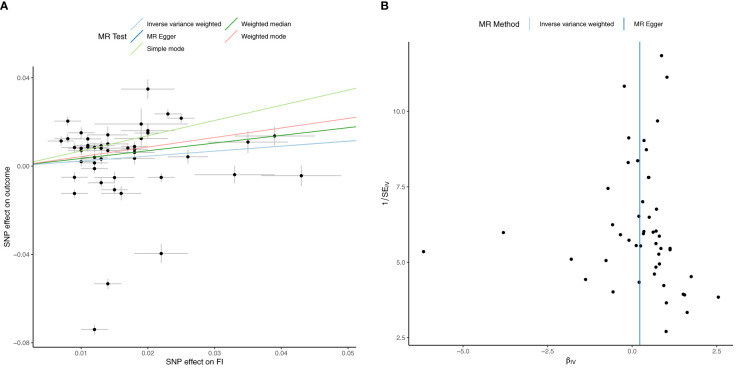
Figure 3.
Univariable Mendelian Randomization (MR) Analysis — Exposure: fasting insulin (FI), Outcome: HbA1c— (A) Scatter plot showing the single nucleotide polymorphisms (SNPs) associated with FI against SNPs associated with HbA1c (vertical and horizontal black lines around points show 95% confidence intervals (CI) for five different Mendelian Randomization (MR) association tests (B) Funnel plot of the effect size against the inverse of the standard error for FI against HbA1c.

