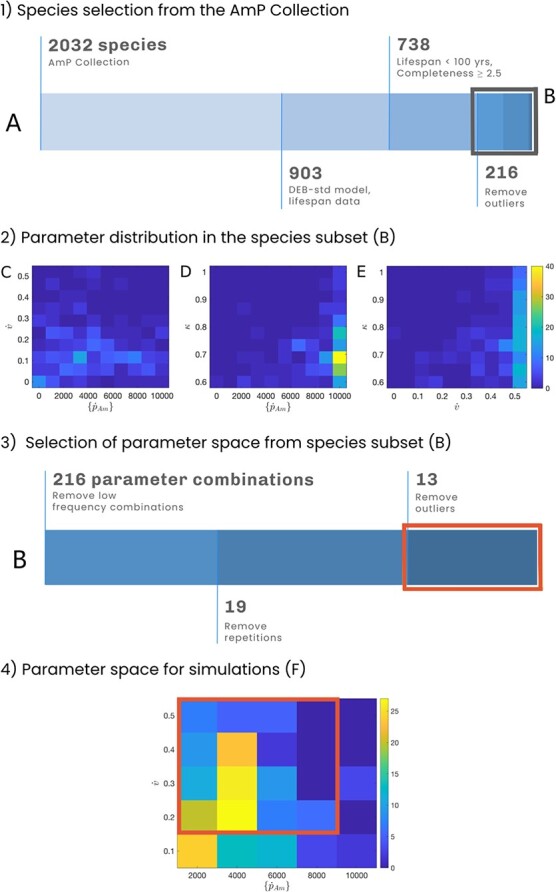
Figure 2.

Representation of the selection process that assured biological consistency in the parameter space. Panel 1 shows the species selection in the AmP collection, starting from all the entries (at 03/2020) to a final subset of 216 species (B). The values indicate the number of species at each step. The steps are: i) subset entries modeled with the DEB-std model and containing lifespan data, ii) subset entries with lifespan below 100 years and data completeness equal or greater than 2.5, and iii) remove entries more than 1.5 interquartile ranges above the upper quartile or below the lower quartile of the parameter distribution. In panel 2, the plots show the bivariate distribution of the parameters  ,
,  , and
, and  in our 216 species subset (B). For all the plots, the parameters' distribution is not uniform. Hence, all parameter combinations are not equally likely to occur. The colour bar shows the joint frequency of occurrence. Panel 3 shows the selection of the joint parameter space for
  and
and  from the species subset B. The values at each step show the number of parameter combinations, starting from 216 to a final subset of 13 parameter combinations (C). The steps are: iv) find the joint distribution of the parameters and remove parameter combinations with a frequency of one, v) remove parameter combinations that are not unique, and vi) remove outlier values. In panel 4, the plot shows the joint distribution of
  and
and  for the 214 parameter combinations most likely to occur in our species subset. The box marks the outer boundary of our parameter space in our parameter combination subset (C). Without repetitions, the parameter space C corresponds to the 16 combinations we evaluated for
  and
and  .
.
