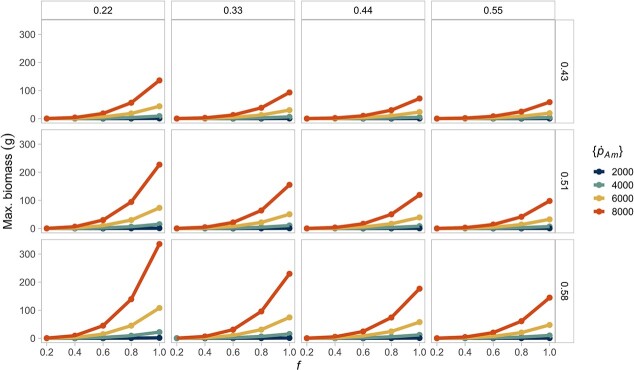
Figure 4.
A decreasing, constant resource ( ) reduces interspecific differences in maximum biomass. The largest biomass is attained when individuals combine high assimilation with low energy conductance. The columns show the different values of energy conductance evaluated (
 ). The rows represent the fraction of energy allocated to soma (
 ). The colours of the lines indicate the value of the maximum specific assimilation rate (
 ). Lines of the same colour in each box (equivalent to a parameter combination) represent the same species at different food levels.

