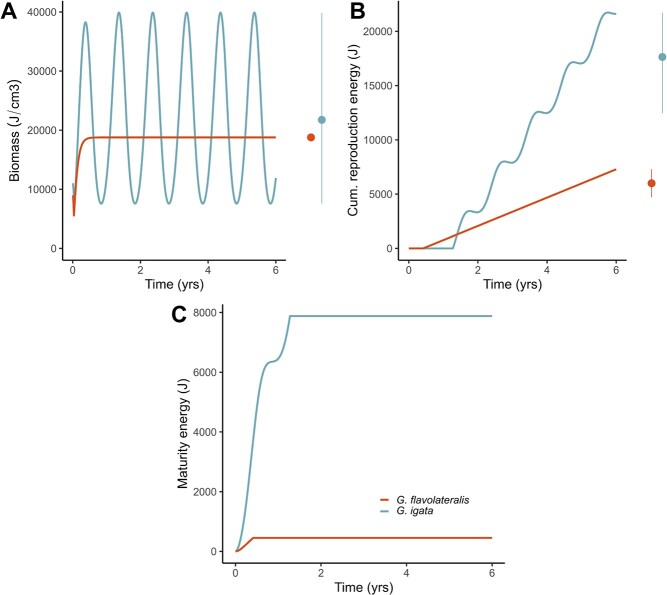
Figure 9.
Simulations for the Grey Warbler (G. igata) in a seasonal environment with an equal mean resource availability as the Fan-tailed Gerygone (G. flavolateralis) in a constant environment show that the Grey Warbler dynamics follow the resource oscillations and reach a greater average wet biomass (A) and reproductive output (B) compared to the Fan-tailed Gerygone. In the right panel of (A), for the species in the constant environment, points show the steady-state value of wet biomass reached at the end of the lifespan. In contrast, for the seasonal environment, points represent the average wet biomass calculated over the last 4 years (i.e. Years 2 to 6), and lines show the minimum and maximum values. In the right panel of (B), for both species, points represent the average cumulative reproduction energy calculated over the last 4 years, and lines correspond to the minimum and maximum values. The Grey Warbler biomass fluctuates according to the resource because the standard DEB model does not consider limits to individuals' shrinking in size in periods of low food availability. Differences in the maturation energy between the species (C) are due to different values of the puberty threshold ( for the Fan-tailed Gerygone and 7880 for the Grey Warbler). The simulations assume
  (see parameter values in Supplementary Table 2).

