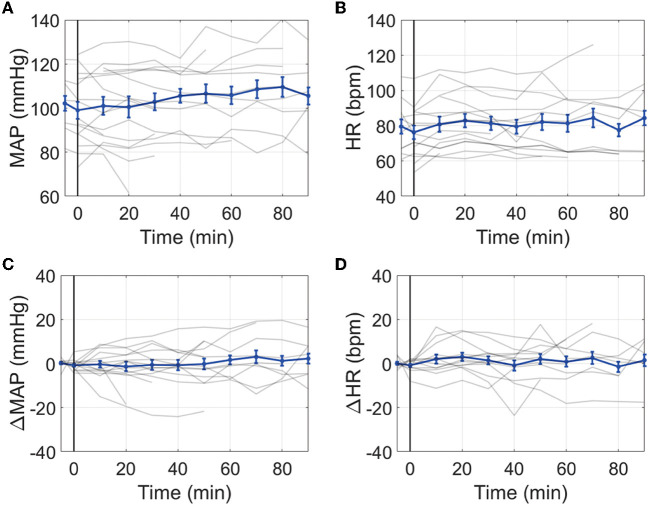
Figure 2.
Effect of IT nicardipine on systemic blood pressure and heart rate: Mean arterial pressure [MAP, (A)], heart rate [HR, (B)], change in MAP from pre-administration levels [ΔMAP, (C)], and change in HR from pre-administration levels [ΔHR, (D)] as a function of time post-administration of IT nicardipine. Thin gray lines in each subplot denote individual patient responses, and thick blue lines denote the mean and standard deviation across all patients. The black vertical line at time = 0 denotes the start of treatment.

