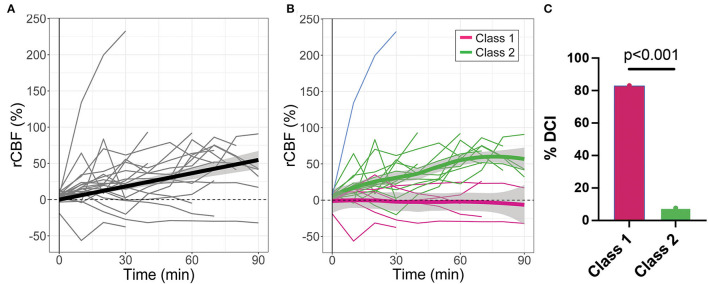
Figure 3.
Relative changes in cerebral blood flow (rCBF) as a function of time post-IT nicardipine administration. (A) Individual patient rCBF trajectories (gray) along with the linear mixed-effects model fit (black). (B) Two distinct latent classes of rCBF response were identified by the latent class mixture model: Class 1 (n = 6, in magenta) showed minimal change in rCBF post-nicardipine, whereas Class 2 (n = 13, in green) exhibited an increase in rCBF over the course of monitoring. The model was overly sensitive to one distinct trajectory (in blue); this outlier trajectory was excluded from analysis. Here, thin lines denote individual patient responses, while thick lines denote the model best fit for each response class. (C) Bar plot of the indicidence of delayed cerebral ischemia (DCI) by rCBF response class.

