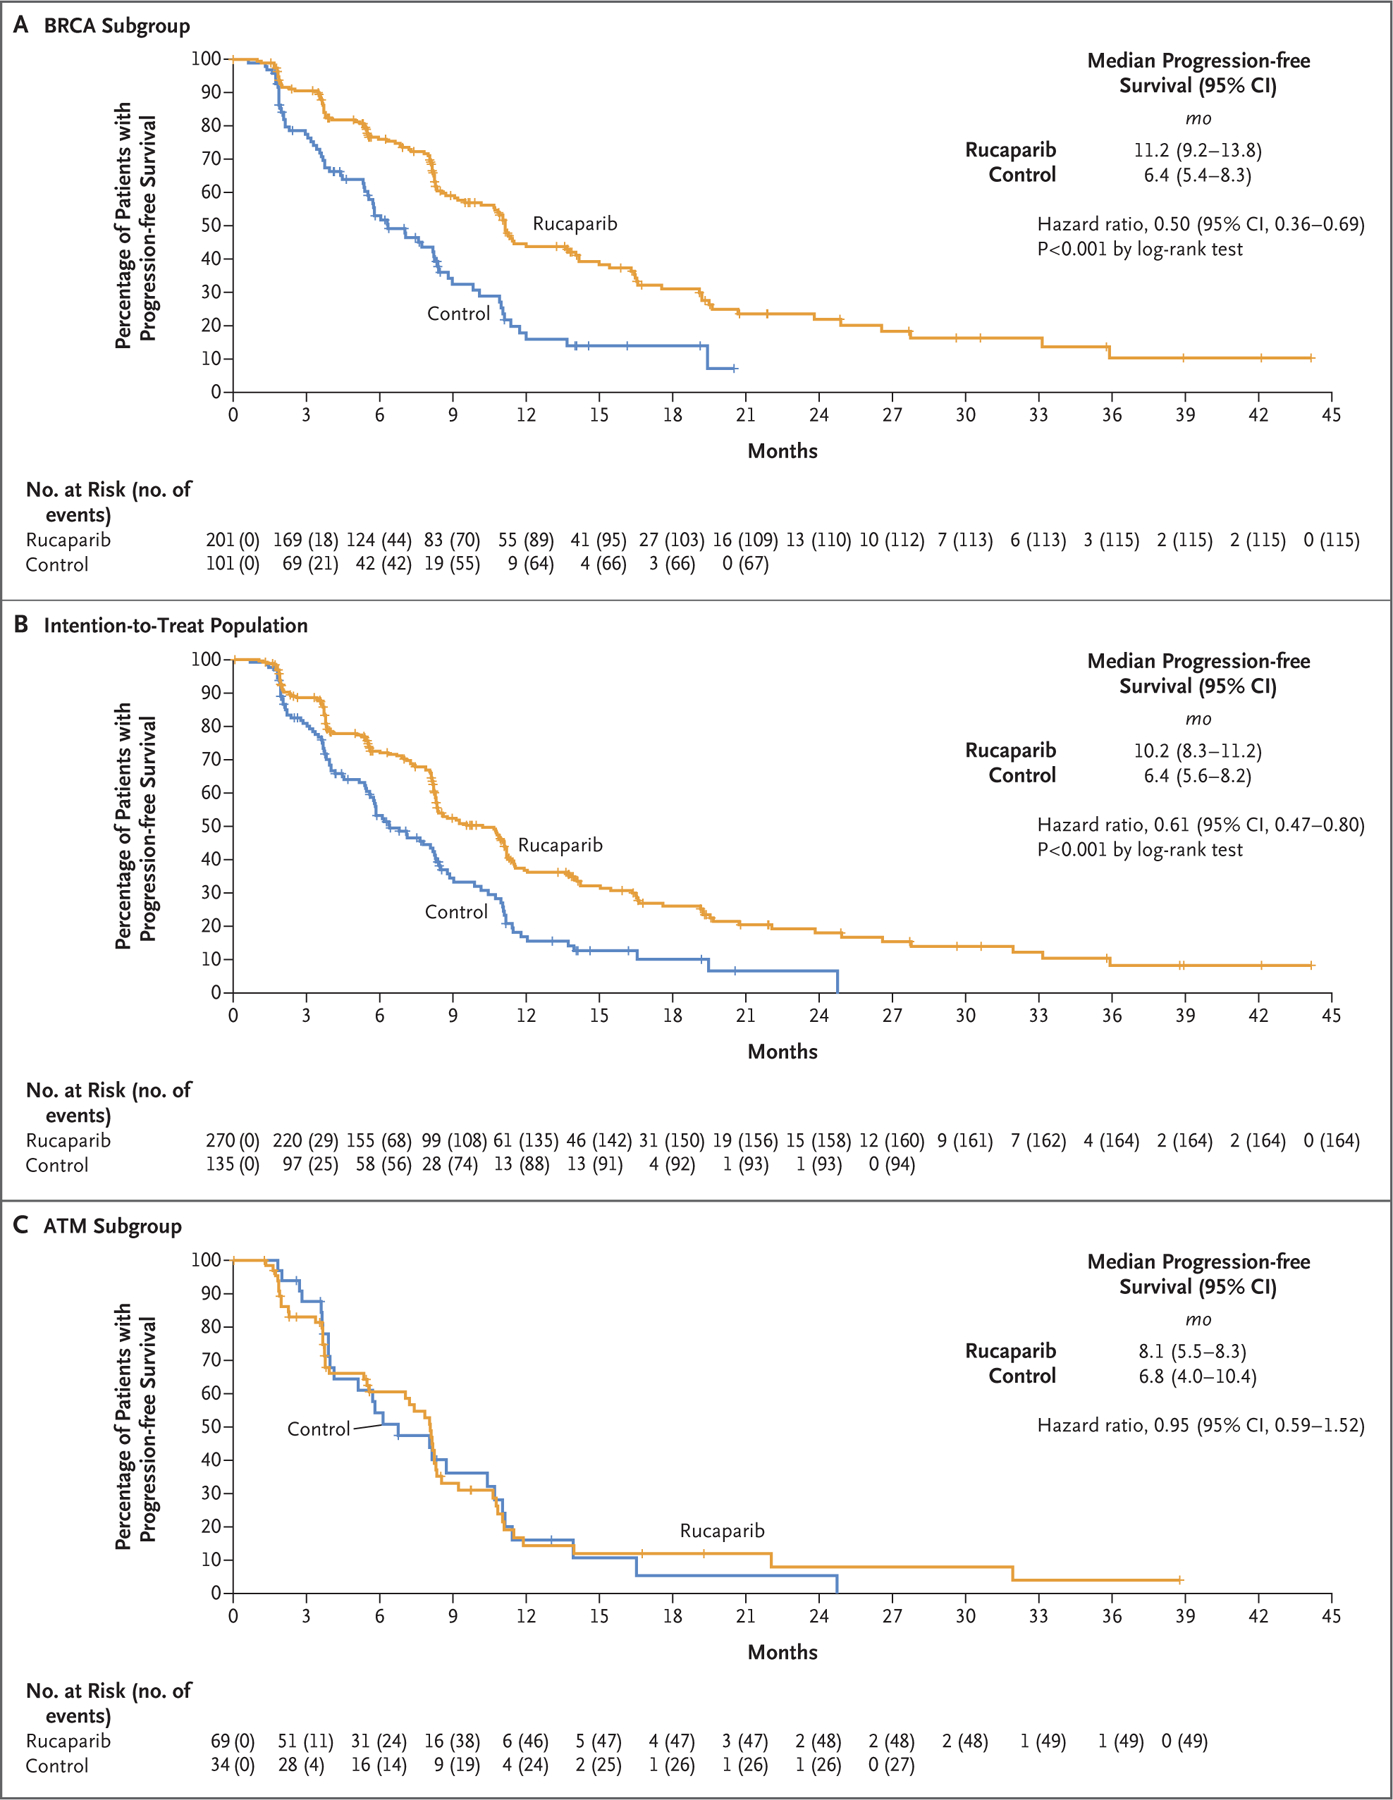
Figure 1. Progression-free Survival in Three Trial Populations.

Shown are Kaplan–Meier curves for imaging-based progression-free survival according to independent review in the BRCA subgroup (Panel A), the intention-to-treat population (Panel B), and the ATM subgroup for rucaparib as compared with a control medication (docetaxel or a second-generation androgen-receptor pathway inhibitor [abiraterone acetate or enzalutamide]). Data maturity was 60% in the BRCA subgroup, 64% in the intention-to-treat population, and 74% in the ATM subgroup. The widths of the 95% confidence intervals were not adjusted for multiplicity and cannot be used in place of hypothesis testing. BRCA denotes BRCA1 and BRCA2, and CI confidence interval.
