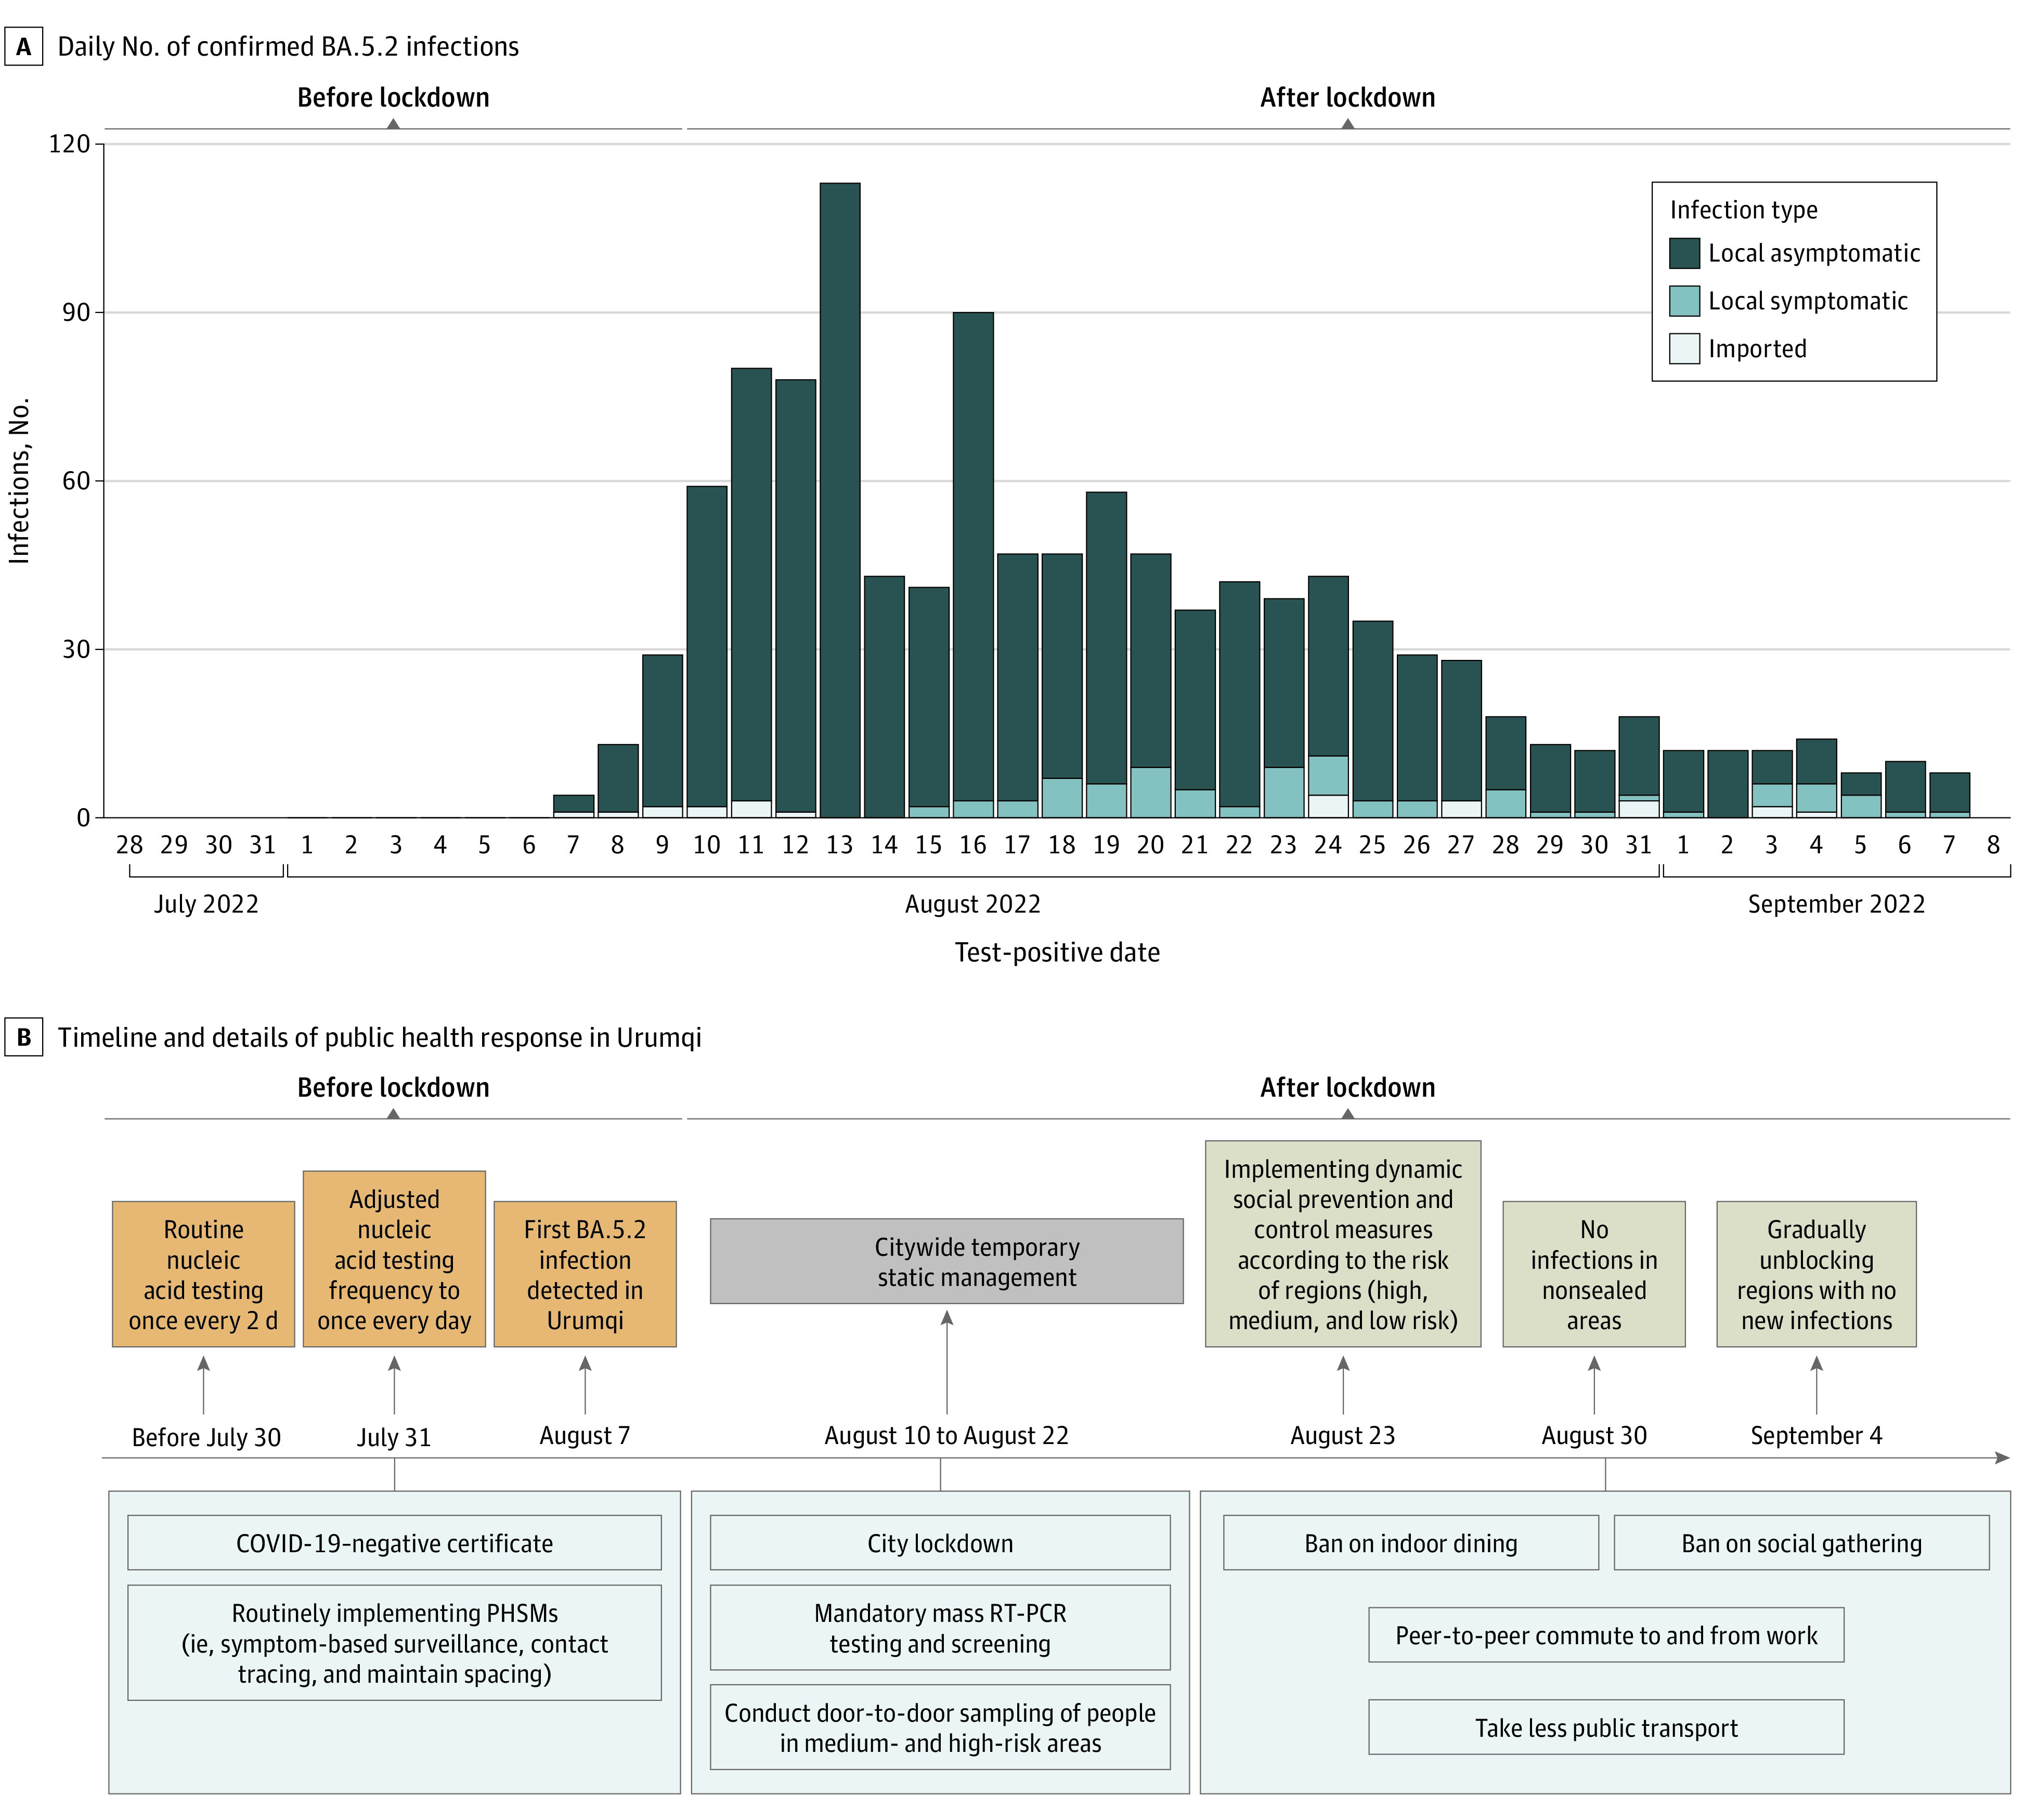
Figure 2. Epidemic Curve of SARS-CoV-2 Infections and Key Public Health Responses.

A, The daily number of confirmed BA.5.2 infections from August 7 to September 7, 2022, in Urumqi, China, is presented. B, The timeline and details of public health responses in Urumqi stratified by epidemic phase are presented. PHSM indicates public health and social measure; RT-PCR, reverse transcription polymerase chain reaction.
