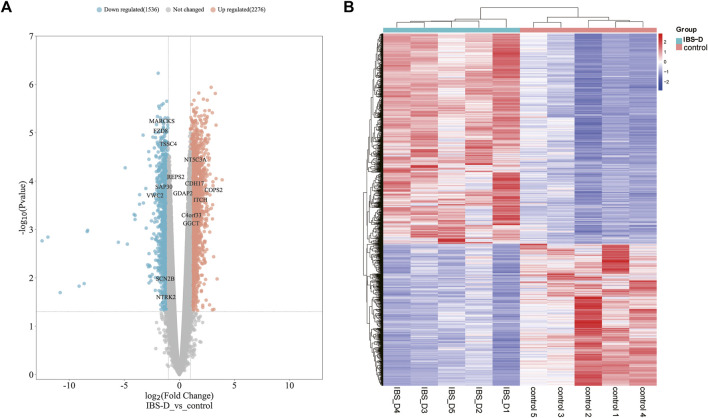
FIGURE 6.
Distribution of differential mRNAs. (A) Volcano map of differential mRNAs. Orange indicates the upregulation of genes, cyan indicates the downregulation of genes, and non-differentially expressed genes are shown in grey. (B) Heat map of differential mRNAs. IBS-D group versus control group.

