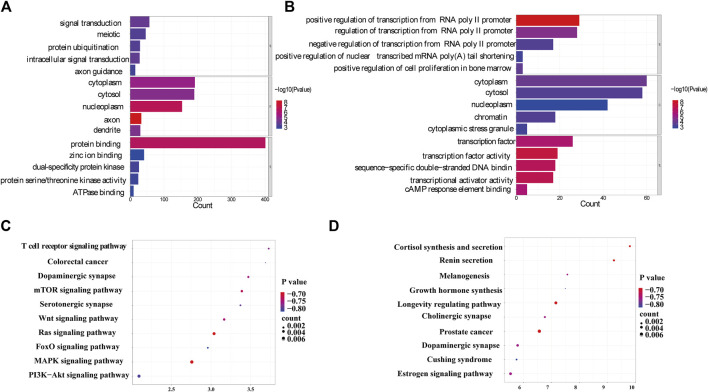
FIGURE 8.
Gene function annotation of differential proteins. (A) The top five annotations from GO terms for upregulated proteins. (B) The top five annotations from GO terms for downregulated proteins. The color represents significant p values, with smaller p values resulting in a darker color. (C) The top ten pathways from KEGG for upregulated proteins. (D) The top ten pathways from KEGG for downregulated proteins. (GO, gene ontology; KEGG, kyoto encyclopedia of genes and genomes; BP, biological processes; MF, molecular function; CC, cellular component).

