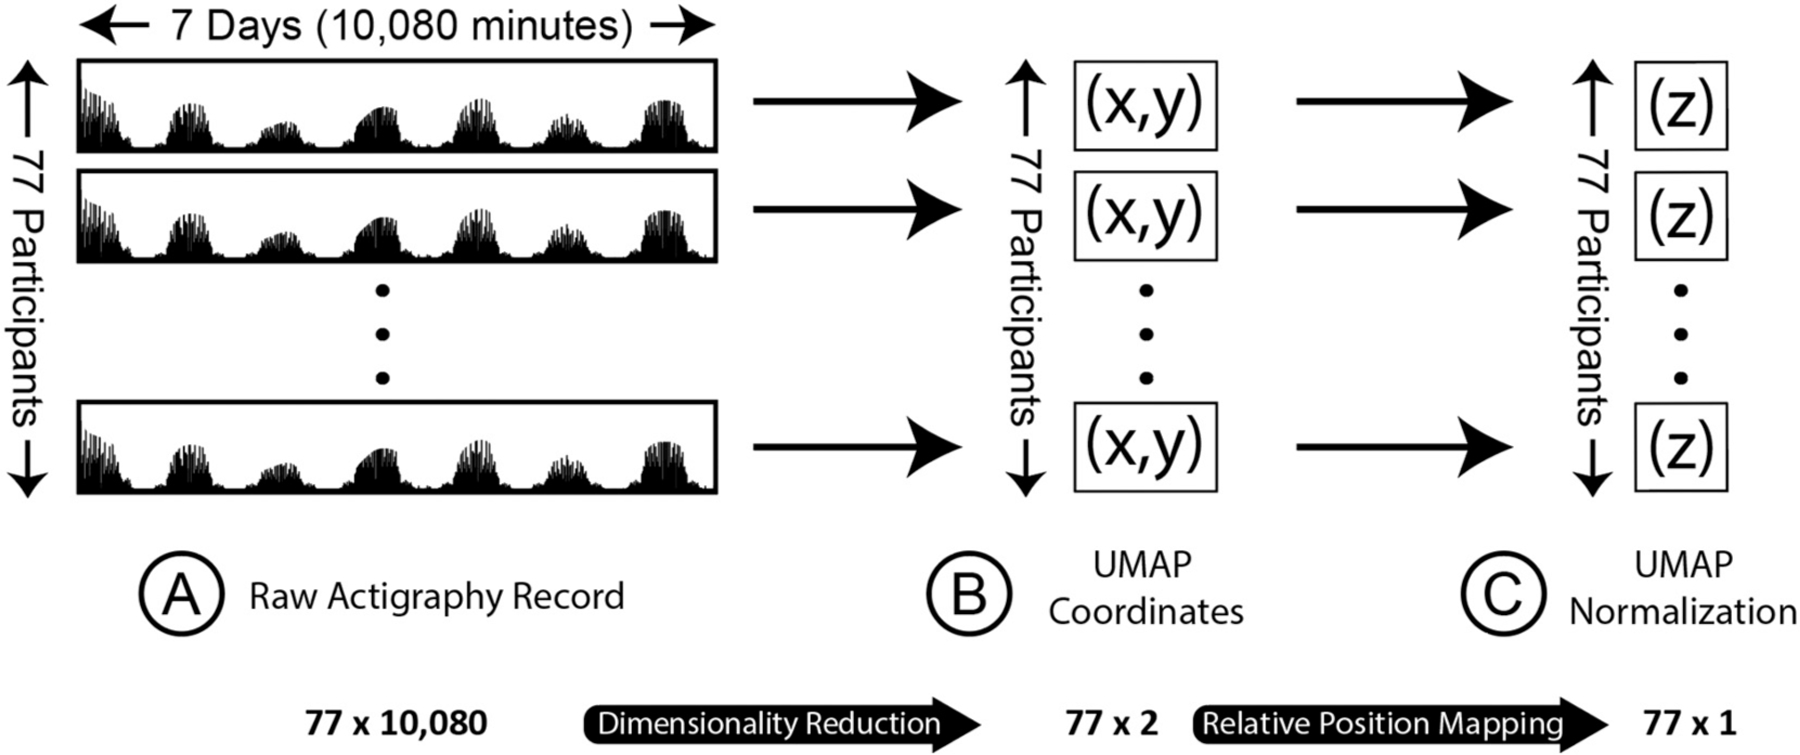
Fig. 1.

Raw actigraphy data processing and dimensionality reduction
(A) Panel A displays in schematic form raw actigraphy records for each of the 77 participants. Each participant has activity data over one week, with 10,080 min-intervals. (B) Using an unsupervised dimensionality reduction algorithm (UMAP), we reduced the 10,080 data points for each participant to two coordinates, which were plotted together on a two-dimensional cartesian coordinate plane. (C) After UMAP two-dimensional reduction, we further reduced the two-dimensional coordinates to a one-dimensional normalization score, in essence representing the participant’s 10,080 time series movement points as a single value.
