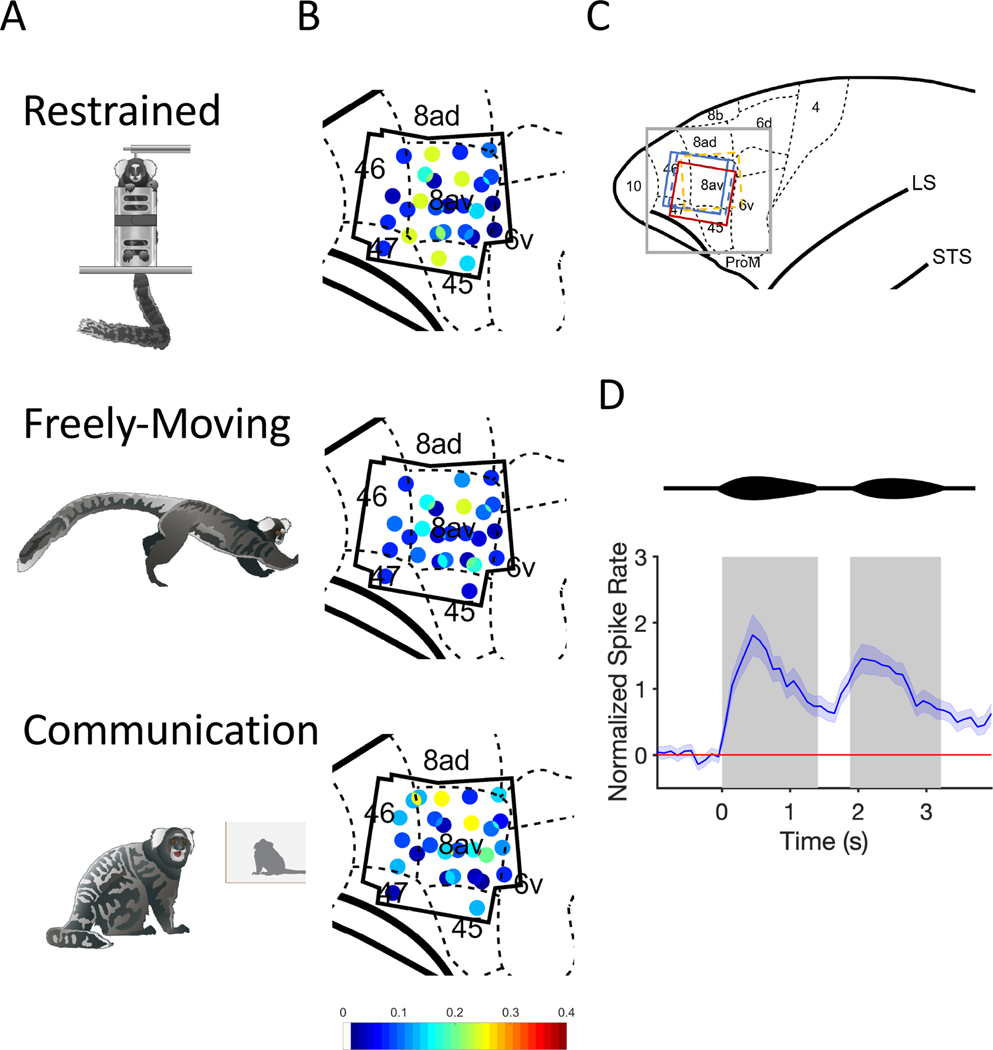
Figure 1. Behavioral Contexts and Recording Locations.
(A) Drawings of the three behavioral contexts. (B) Distribution of phee responsive neurons in marmoset PFC for all three contexts. Black polygonal shape represents the outline of the four electrode arrays across three marmosets. Each dot represents one electrode channel and its ratio (indicated by the color bar) of phee responsive neurons relative to all single neurons recorded at that location. (C) Anatomical map of the frontal cortex. Gray square represents the zoomed in portion of PFC depicted in B. Colored squares represent the position and orientation of the four electrode arrays. Dashed lines = right hemisphere implants, Solid lines = left hemisphere. Color bar indicates the proportion of pheeresponsive neurons, which are shown in the colored dots in the anatomical map (D) Two-pulsed marmoset phee call is shown above a normalized PSTH with 95% Confidence Interval for all phee-responsive neurons. Gray boxes indicate the average duration of phee pulses.

