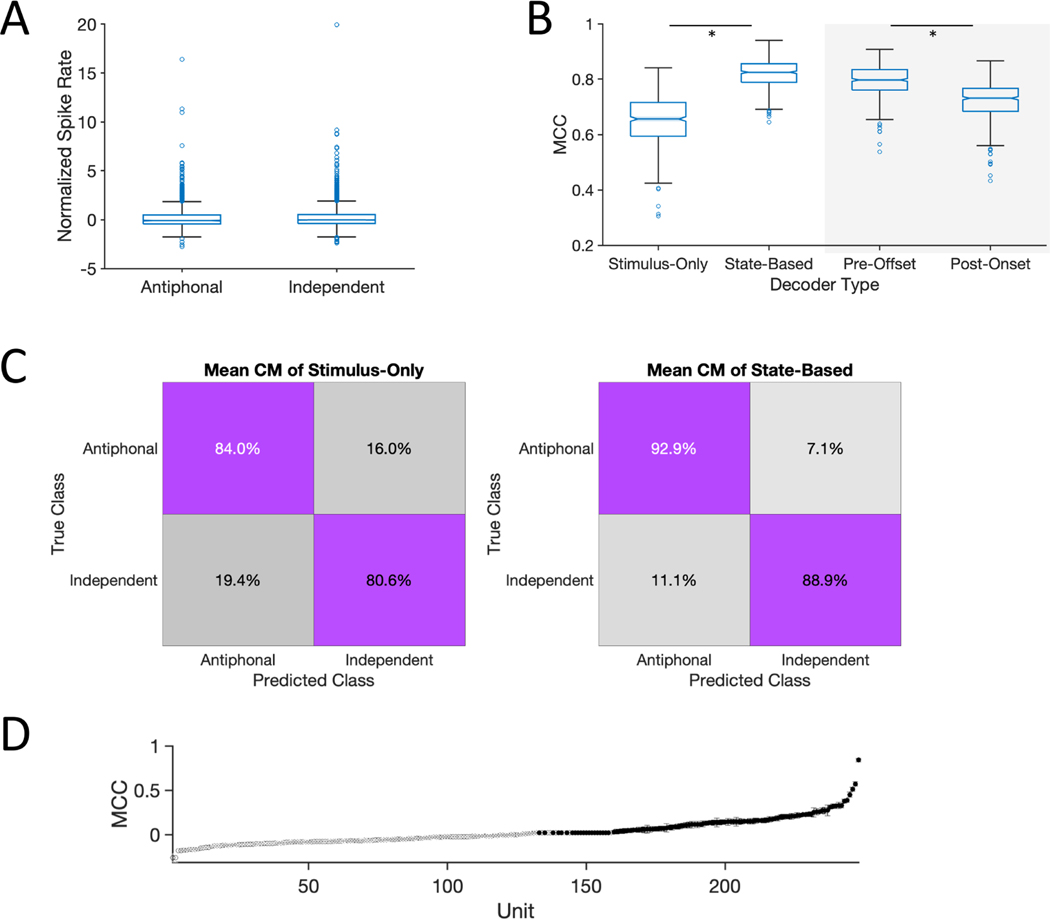
Figure 4. Social State Modulation of PFC.
(A) Box plots show the normalized firing rate of neurons phee responsive neurons in the ‘Antiphonal’ and ‘Independent’ contexts. Single blue circles represent individual neurons. (B-Left) Performance of ‘Stimulus-Only’ and ‘State-Based’ neural decoders. (B-Right) Performance of PreStim and PostStim neural decoder. (C) Mean confusion matrix for decoder performance for Stimulus-Only (left) and State-Based (right). (D) Individual unit performance of units in the State-Based decoder. 109 neurons with accuracies above chance with 99.9% confidence are shown in black. 99.9% confidence interval bounds are plotted but are too small to be visible. * statistically significant.

