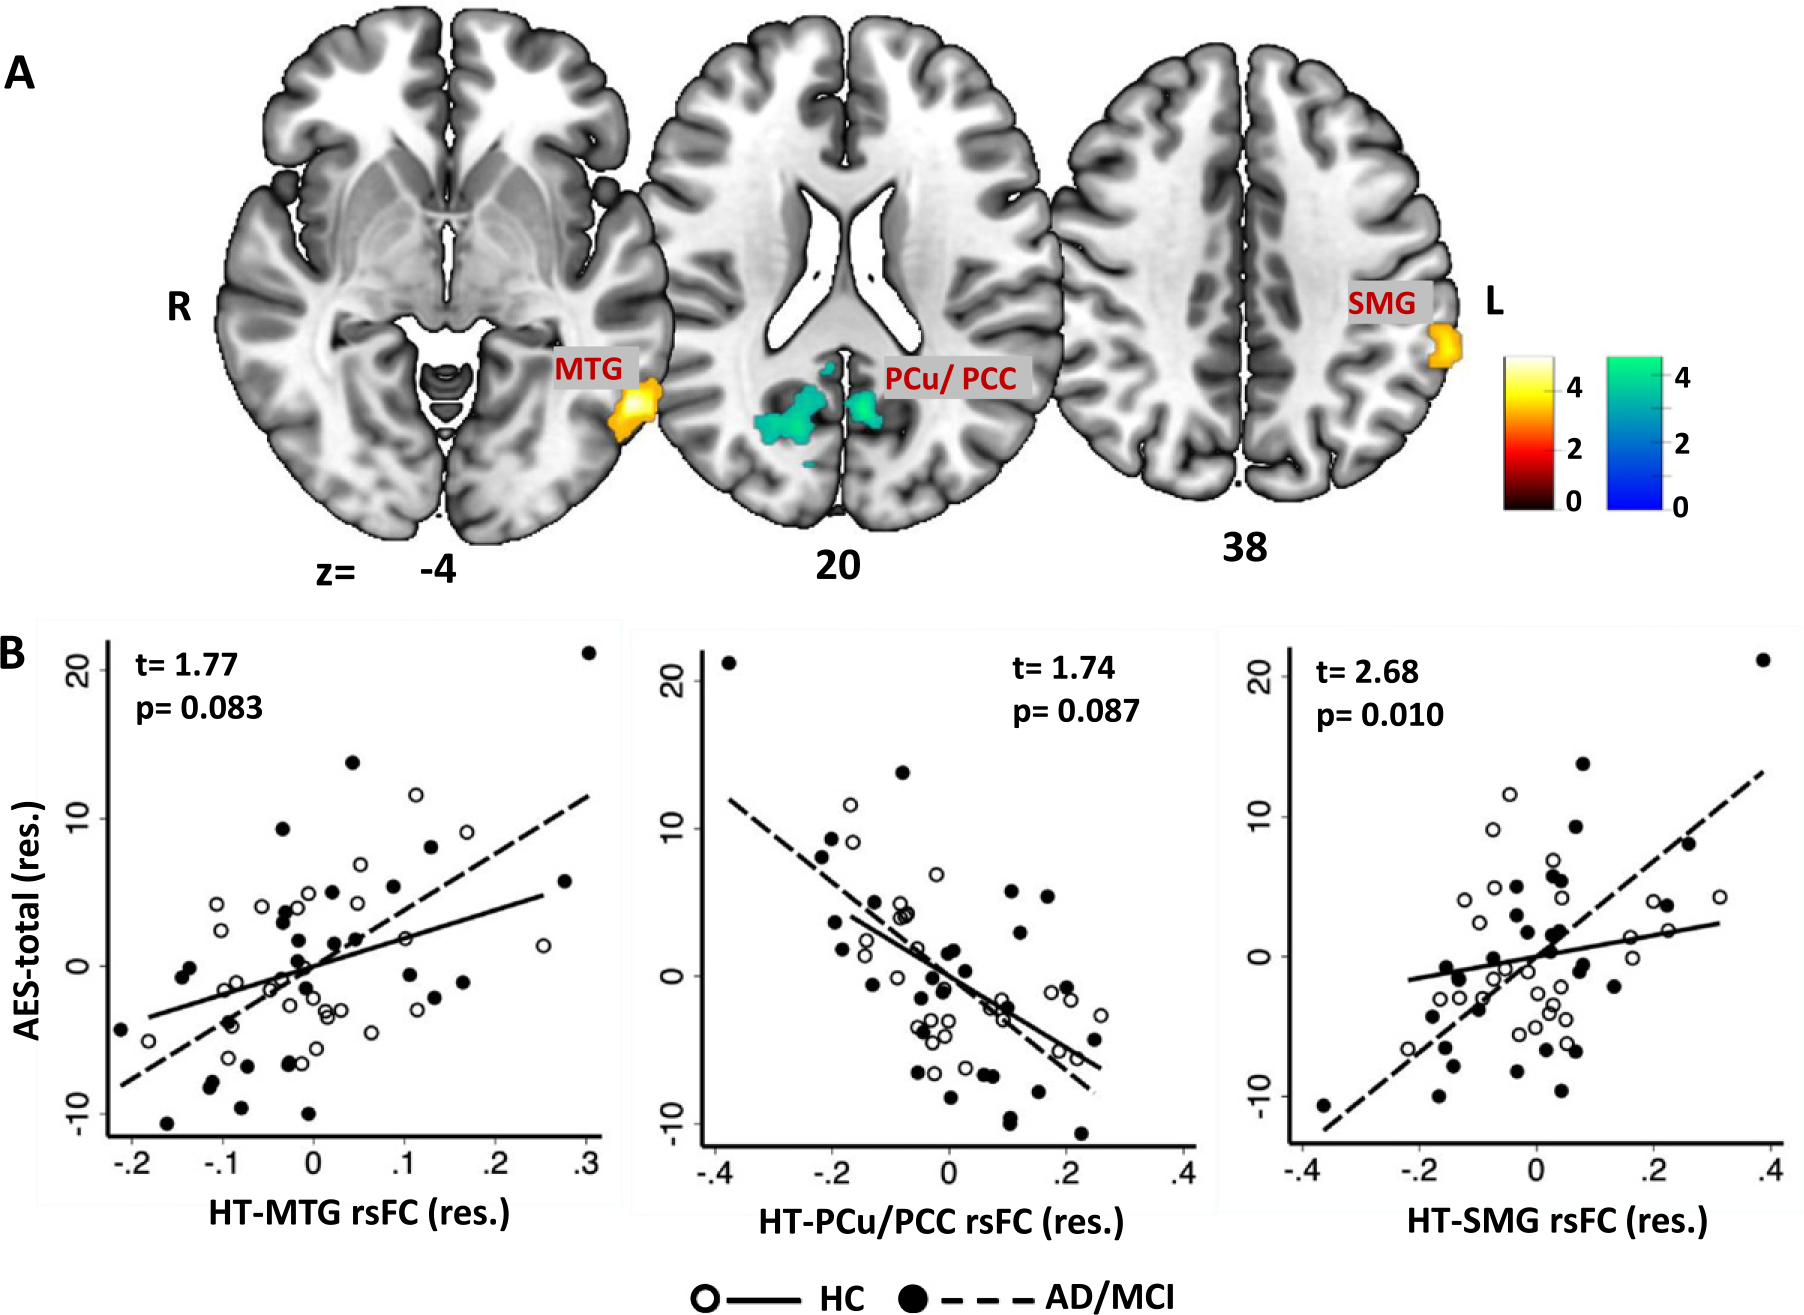
Fig. 1.

Whole-brain multiple regression of hypothalamus (HT) resting state functional connectivity (rsFC) with (A) AES-total score in all (HC and AD/MCI) sample. Warm and winter color bars represent T-values of positive and negative correlations, respectively. B) Scatterplot of AES-total and HT rsFCs (β) with regression line shown separately for HC and AD/MCI. Note that the scatterplots show values in residuals (res.) and the t- and p-values show slope test between HC and AD-MCI for the corresponding correlations. For all regressions, we controlled for age, sex, education, MMSE, and BDI-II. MTG, middle temporal gyrus; PCu, precuneus; PCC, posterior cingulate cortex; SMG, supramarginal gyrus.
