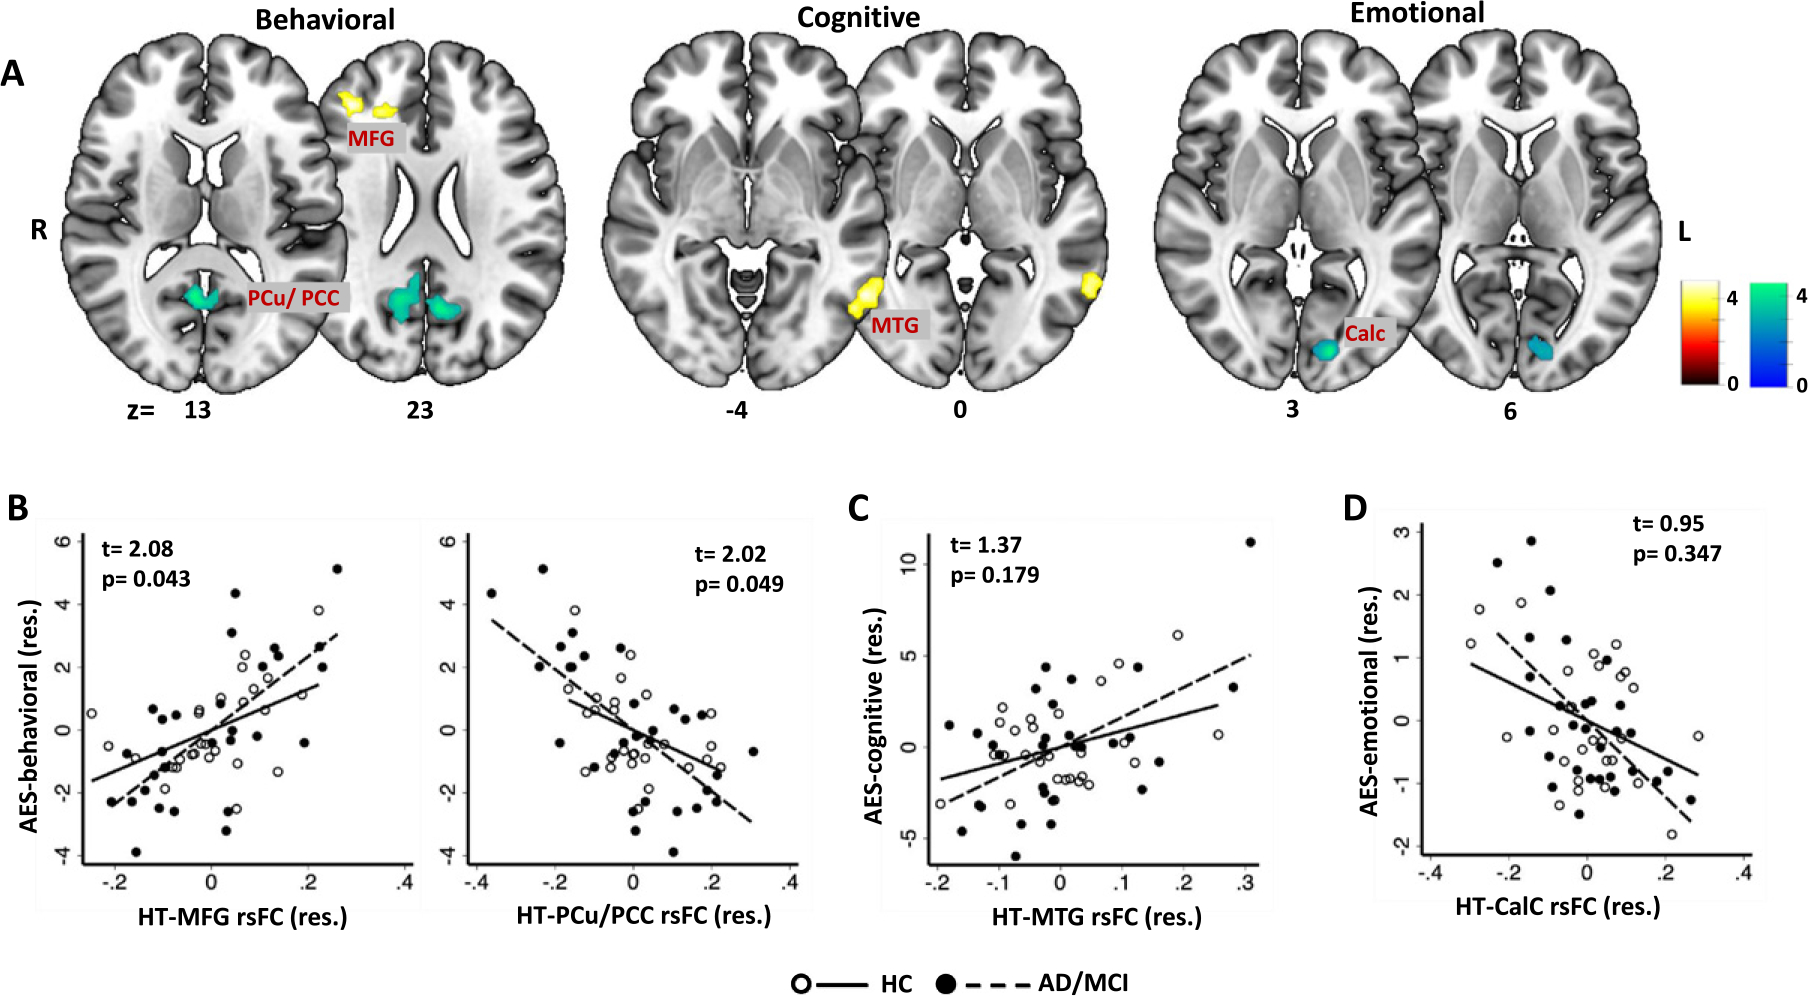
Fig. 2.

Whole-brain multiple regression of hypothalamus (HT) resting state functional connectivity (rsFC) with (A) AES behavioral, cognitive, and emotional subscores across all subjects. Color bars indicate voxel T values (warm/cool: positive/negative correlation). MFG, middle frontal gyrus; MTG, middle temporal gyrus; PCu, Precuneus; PCC, posterior cingulate cortex; Calc, calcarine cortex. The bottom row shows the scatterplots of AES (B) behavioral, (C) cognitive, and (D) emotional sub-scores versus extracted HT rsFCs (β) with regression lines shown separately for HC and AD/MCI. Note that the scatterplot represents values in residuals (res.) and the t- and p-values are of the slope tests of HC versus AD/MCI for the corresponding correlations. For all analyses, we controlled for age, sex, education, MMSE, and BDI-II.
