Figure 6.

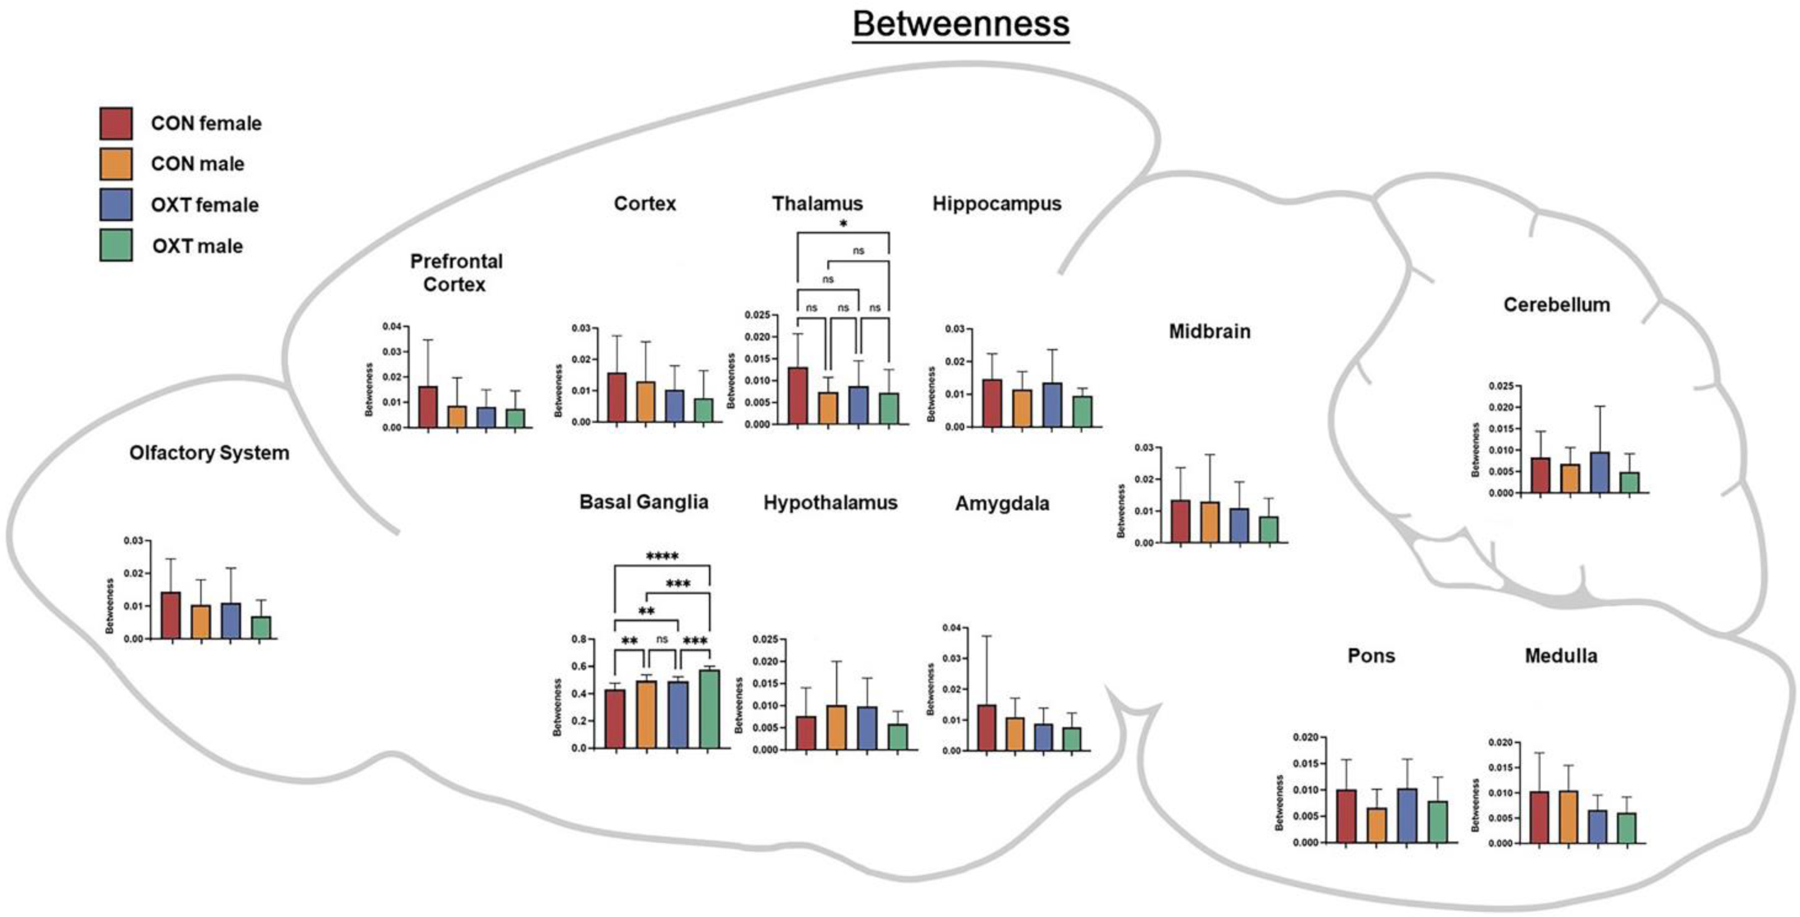
A map of betweenness averaged over regional clusters by group. For example, the ‘Hippocampus’ cluster includes the: CA1, CA3, Dentate gyrus, Subiculum and Parasubiculum. * p < 0.0332, ** p < 0.0021, *** p < 0.0002, **** p <0.0001.

A map of betweenness averaged over regional clusters by group. For example, the ‘Hippocampus’ cluster includes the: CA1, CA3, Dentate gyrus, Subiculum and Parasubiculum. * p < 0.0332, ** p < 0.0021, *** p < 0.0002, **** p <0.0001.