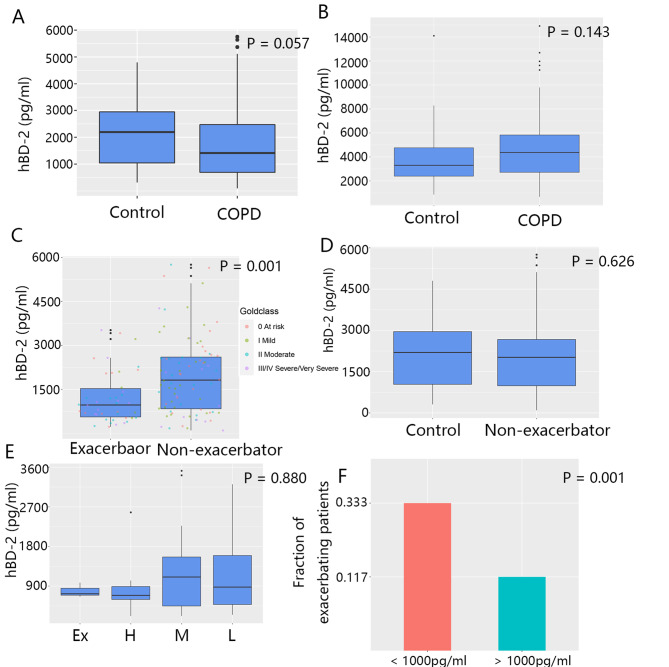
Fig. 1.
Sputum and serum hBD-2 levels in COPD exacerbators, non-exacerbators, and controls at baseline. (A–B) hBD-2 levels in the sputum (A) and serum (B) in patients and controls measured by ELISA. (C) The hBD-2 levels of patients who never experienced exacerbation were compared with those of patients who experienced exacerbation at least once. (D) The sputum hBD-2 levels of patients without any exacerbation were compared to those of controls. (E) Patients were categorized into four subgroups according to the frequency of exacerbations. The sputum hBD-2 levels were compared between subgroups (ex-high, > 2 per year; high, 1.5–2 per year; medium, 1–1.5 per year; and low, < 1 per year). (F) According to a cutoff level (1000 pg/mL), patients were grouped into two subsets: the higher subset (> 1000 pg/mL) and the lower subset (< 1000 pg/mL). The proportion of patients experiencing an exacerbation within the following 12 months was calculated. Statistical methods: Kruskal-Wallis (A, B, D, and E); Wilcoxon (C); and chi-square test (F) (for more details about Fig. 1, see Additional file 1: Table S5)

