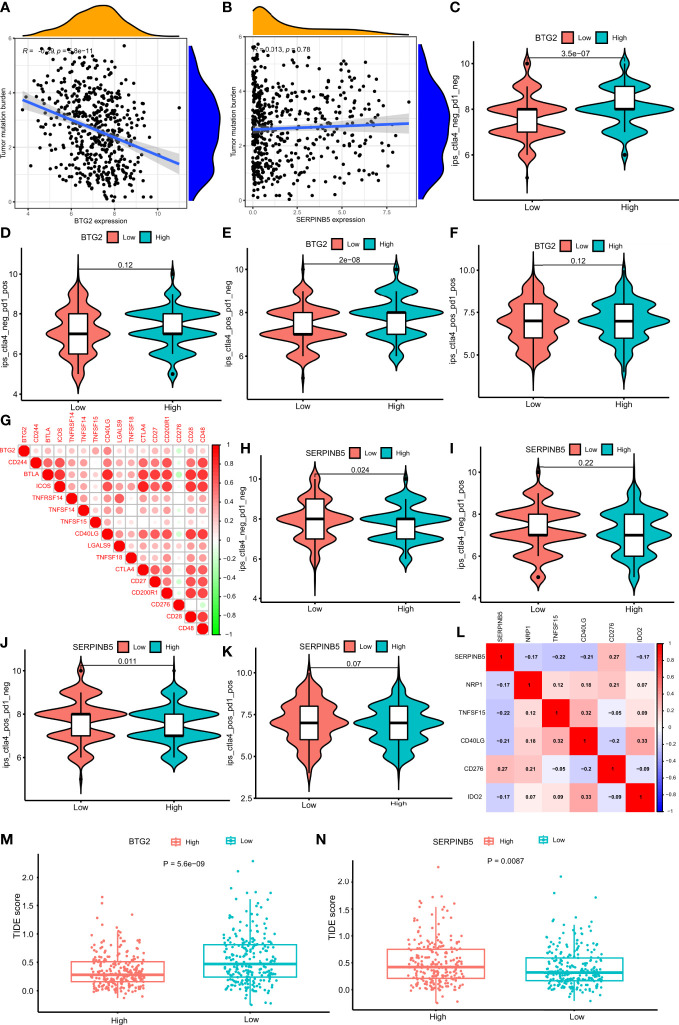
Figure 10.
Comparison of the IPS in four groups and the relationship of the genes. (A) Correlation analysis of BTG2 expression and TMB in LUAD. (B) Correlation analysis of SerpinB5 expression and TMB in LUAD. (C–F) Comparison of the IPS between high- and low-expression groups of BTG2, IPS-CTLA4 negative + PD-1 negative, IPS-CTLA4 negative + PD-1 positive, IPS-CTLA4 positive + PD-1 negative, IPS-CTLA4 positive + PD-1 positive. (G) Correlations between BTG2 and Immune checkpoints associated with BTG2. Corr denotes Pearson correlation coefficient. The red nodes represent positive correlation with BTG2 while the green nodes represent negative correlation with BTG2. (H–K) Comparison of the IPS between high- and low-expression groups of SerpinB5, IPS-CTLA4 negative + PD-1 negative, IPS-CTLA4 negative + PD-1 positive, IPS-CTLA4 positive + PD-1 negative, IPS-CTLA4 positive + PD-1 positive. (L) Correlations between SerpinB5 and Immune checkpoints associated with the gene. Corr denotes Pearson correlation coefficient. The red nodes represent positive correlation with the gene while the green nodes represent negative correlation with the gene. (M) Boxplot representation of TIDE scores in the high-group versus low-group of BTG2 in TCGA LUAD cohort. (N) Boxplot representation of TIDE scores in the high-group versus low-group of SerpinB5 in TCGA LUAD cohort.

