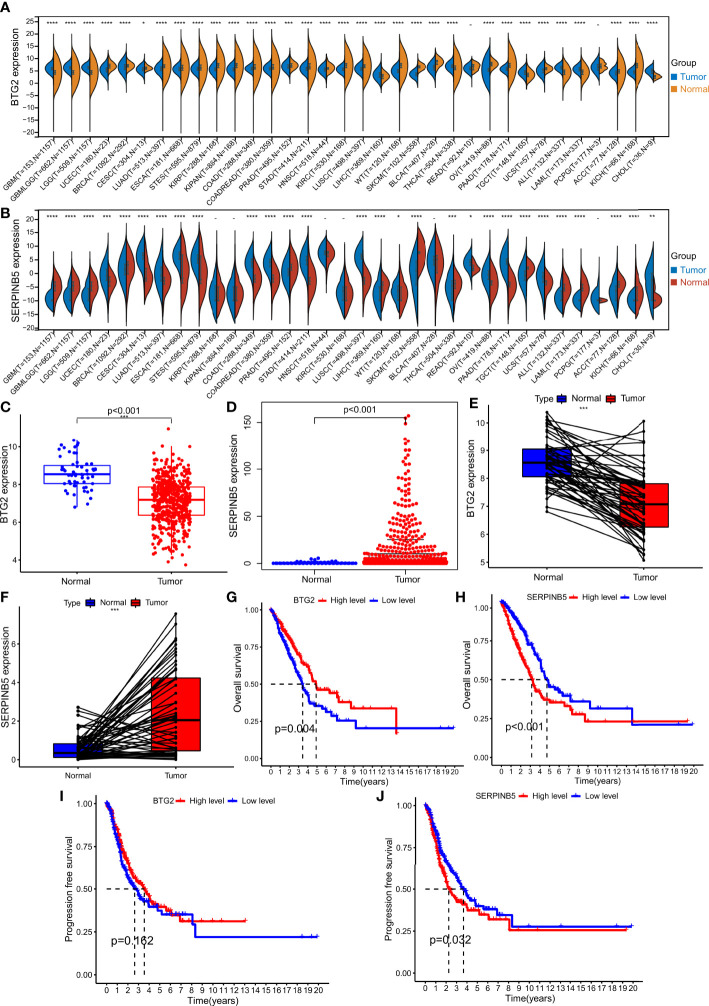
Figure 3.
The expression levels in Pan cancer and LUAD and the survival analysis of BTG2 and SerpinB5. (A) BTG2 expression levels in multiple types of human cancers and adjacent normal tissues across TCGA (*P < 0.05, **P <0.01, ***P < 0.001). (B) SerpinB5 expression levels in multiple types of human cancers and adjacent normal tissues across TCGA. (C, E) The expression level of BTG2 in LUAD and normal lung tissues. BTG2 was more highly expressed in LUAD compared with normal lung tissues. (D, F) The expression level of SerpinB5 in LUAD and normal lung tissues. BTG2 was more highly expressed in LUAD compared with normal lung tissues. (G–H) The relationship between BTG2 and SerpinB5 expression and OS in LUAD patients. (I-J) The relationship between BTG2 and SerpinB5 expression and PFS in LUAD patients. (A) (*P < 0.05, **P <0.01, ***P < 0.001, ****P<0.0001, "-" respect P≥0.05).

