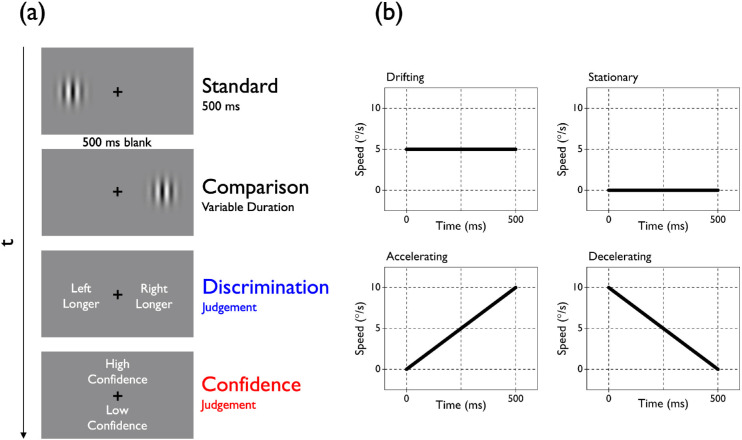
Figure 1.
Experimental task and stimuli. (a) Schematic illustration of the procedure adopted in Experiments 1 and 2. Two visual stimuli (luminance-modulated Gabors similar to those depicted here in Experiment 1; simple gratings in Experiment 2) were sequentially presented (separated by a 500-ms blank page) and participants were required to make two decisions using their computer keyboard. First, they had to judge the relative duration of the intervals that contained the test stimuli (“Which is longer?”), and then they rated their confidence in their discrimination judgment (“How confident are you your response was correct?”). The standard duration was fixed across trials (500 ms), whereas the comparison duration varied on a trial-by-trial basis (between 200 and 800 ms in Experiment 1 and between 50 and 950 ms in Experiment 2). (b) Speed profiles over time for the standard stimulus in the four experimental conditions. In the drifting condition, the speed of the standard remained constant at 5°/s across the interval. In the stationary condition, there was no motion associated with the standard. In the accelerating condition, the speed of the standard increased linearly across the interval from 0°/s to 10°/s (average speed, 5°/s). In the decelerating condition, the speed of the standard decreased linearly across the interval from 10 to 0°/s (average speed, 5°/s). In all of the experimental conditions, the comparison stimulus always drifted at a constant rate of 5°/s.

