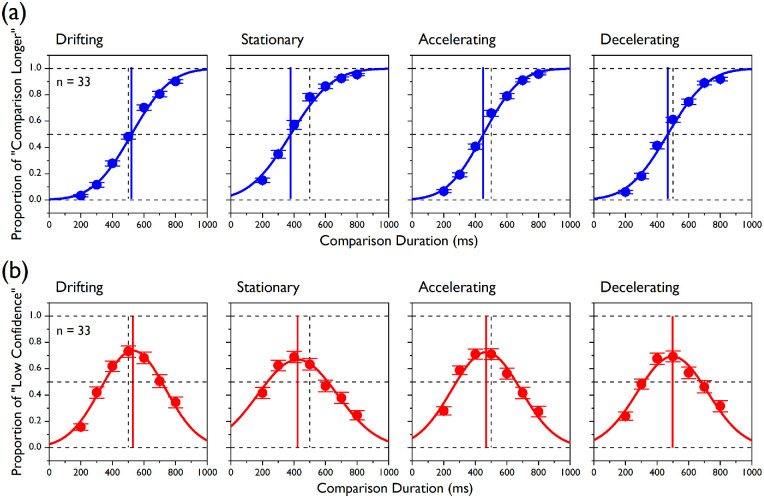
Figure 2.
Group data in Experiment 1. (a) Cumulative Gaussian functions (fitted through data from all participants at once; blue fits) are plotted for discrimination judgments together with the mean proportions of “comparison longer” responses (averaged across all participants; blue circles) for all the seven comparison durations and for the four experimental conditions. Note that those fits are shown here and in panel b for reference but the statistics are based on psychometric fits to individual data. The vertical blue lines represent the PSEs (i.e., corresponding to the 50% points on the functions), and the vertical dashed lines (here and in panel b) indicate the actual standard duration (i.e., 500 ms). (b) Raised Gaussian functions (red fits) are plotted for confidence judgments together with the mean proportions of “low confidence” responses for all of the comparison durations and all of the experimental conditions. The vertical red lines point to the duration levels corresponding to the PMCs (i.e., the peaks of “low confidence” responses). Error bars indicate ±1 SEM.

