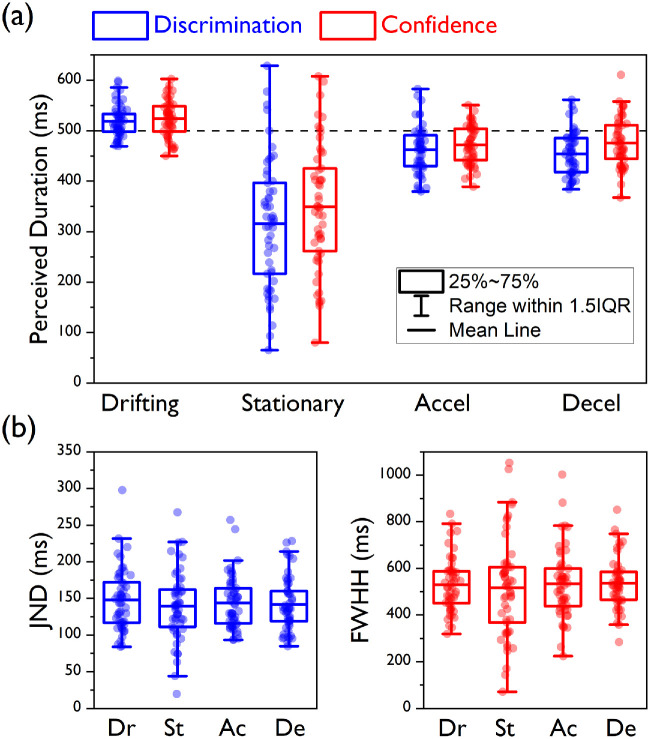
Figure 5.
Central tendency and precision estimates for Experiment 2. (a) Box plots for the PSEs (blue) and the PMCs (red) are presented here for all of the experimental conditions. Here and in panel b the boxes are drawn from the first to the third quartile, the blue and red horizontal lines depict the means, and the whiskers are drawn to the highest and lowest data points within 1.5 times the distance between the first and third quartile (i.e., the interquartile range) from above the third quartile and from below the first quartile, respectively. Circular symbols represent individual PSE and PMC estimates. The horizontal dashed line indicates the actual standard duration. (b) Box plots for the JNDs of the discrimination judgments (blue, left panel) and the FWHH for the confidence judgments (red, right panel) for all of the experimental conditions.

